
|
Fig. S6
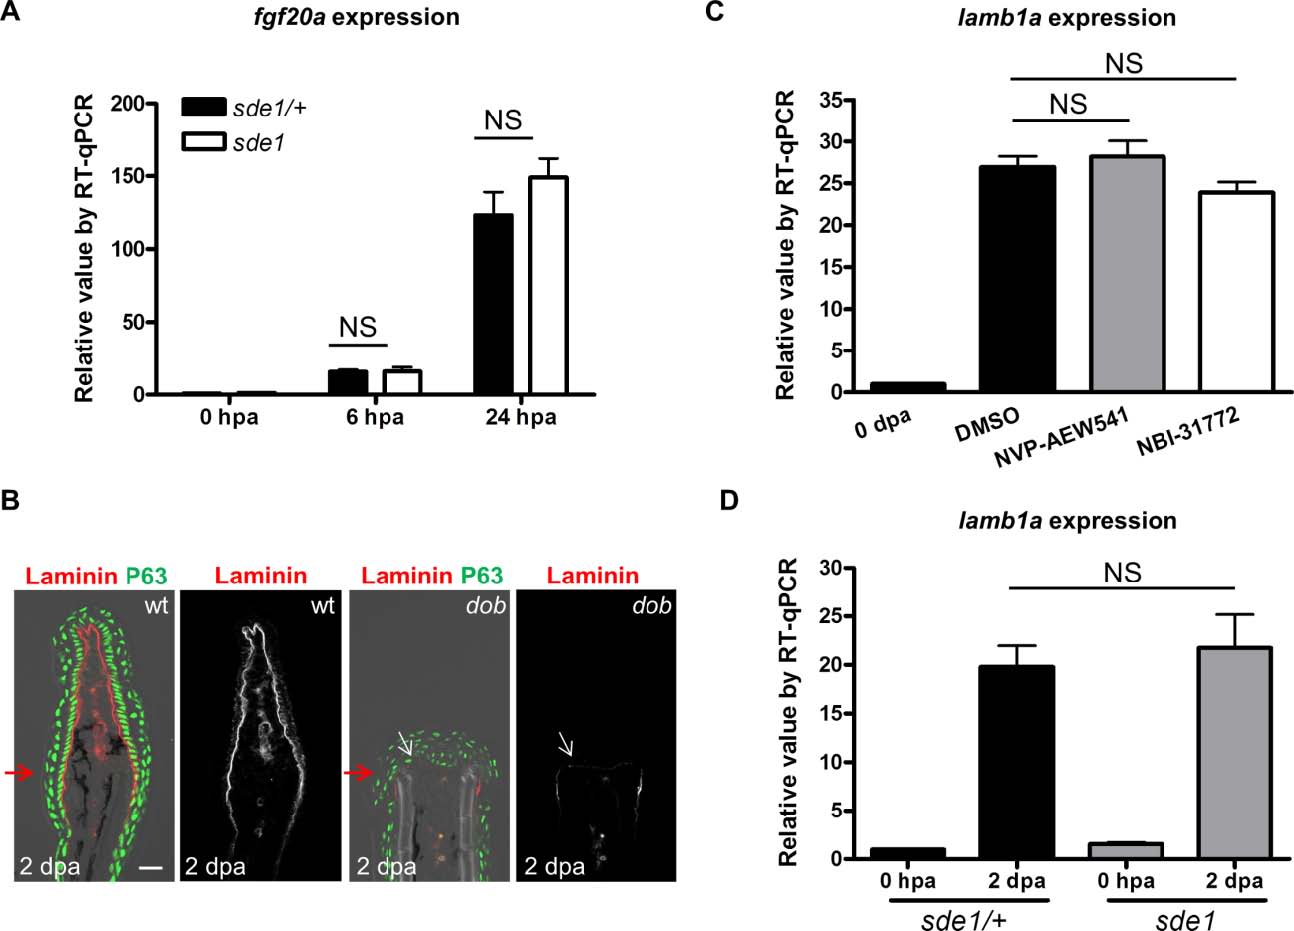
Tests of association between fgf20a and lamba1.
(A) RT-qPCR analysis for levels of fgf20a in sde1 fin regenerates. qPCR results were normalized to rpl13a and to the basal expression of fgf20a at 0 hpa. (n = 3; mean ± SEM; Student’s t -test, NS, non-significant). (B) Antibody co-staining for Laminin (red) and P63 (green) in longitudinal sections of wild-type and dob fin regenerates at 2 dpa. Scale bars, 50 µm. White arrows indicate where (low) levels of Laminin are detectable. Red arrows indicate plane of amputation. (C) RT-qPCR analysis lamb1a levels in 4 dpa wild-type fin regenerates after 24 hours of treatment with either Igf receptor antagonist NVP-AEW541 (2 µM), or Igf signaling agonist NBI-31772 (10 µM). (D) RT-qPCR analysis of lamb1a levels in 2 dpa sde1/+ and sde1 fin regenerates at the restrictive temperature. qPCR results were normalized to rpl13a and to the basal expression of lamb1a at 0 hpa. (n = 4; mean ± SEM; Student’s t -test, NS, non-significant).