
Image
|
Figure Caption
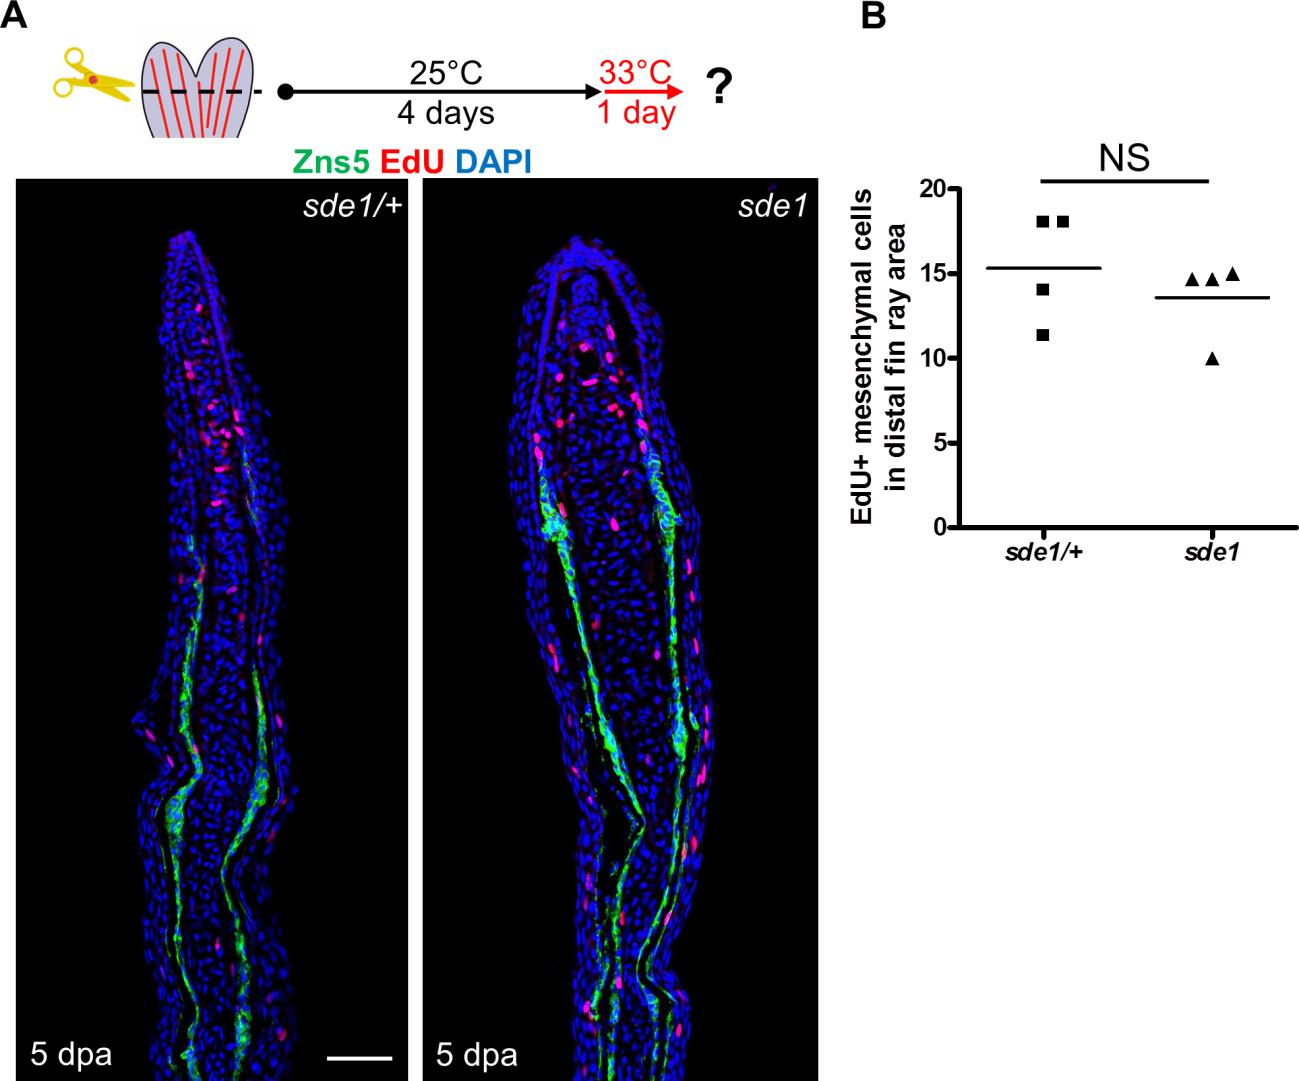
Fig. S5
EdU incorporation assays in sde1 and control regenerates.
(A) Longitudinal sections of 5 dpa fin regenerates collected after 60 minutes of EdU incorporation. (B) Counting of EdU+ mesenchymal cells in distal fin ray area. Mesenchymal cell proliferation was grossly similar between sde1/+ and sde1 regenerates at 5 dpa after a temperature shift from 25°C to 33°C at 4 dpa. Scale bars, 50 µm. (n = 4, counts from three sections were averaged for each sample; Student’s t -test, NS, non-significant).
Acknowledgments
This image is the copyrighted work of the attributed author or publisher, and
ZFIN has permission only to display this image to its users.
Additional permissions should be obtained from the applicable author or publisher of the image.
Full text @ PLoS Genet.