
|
Fig. 1
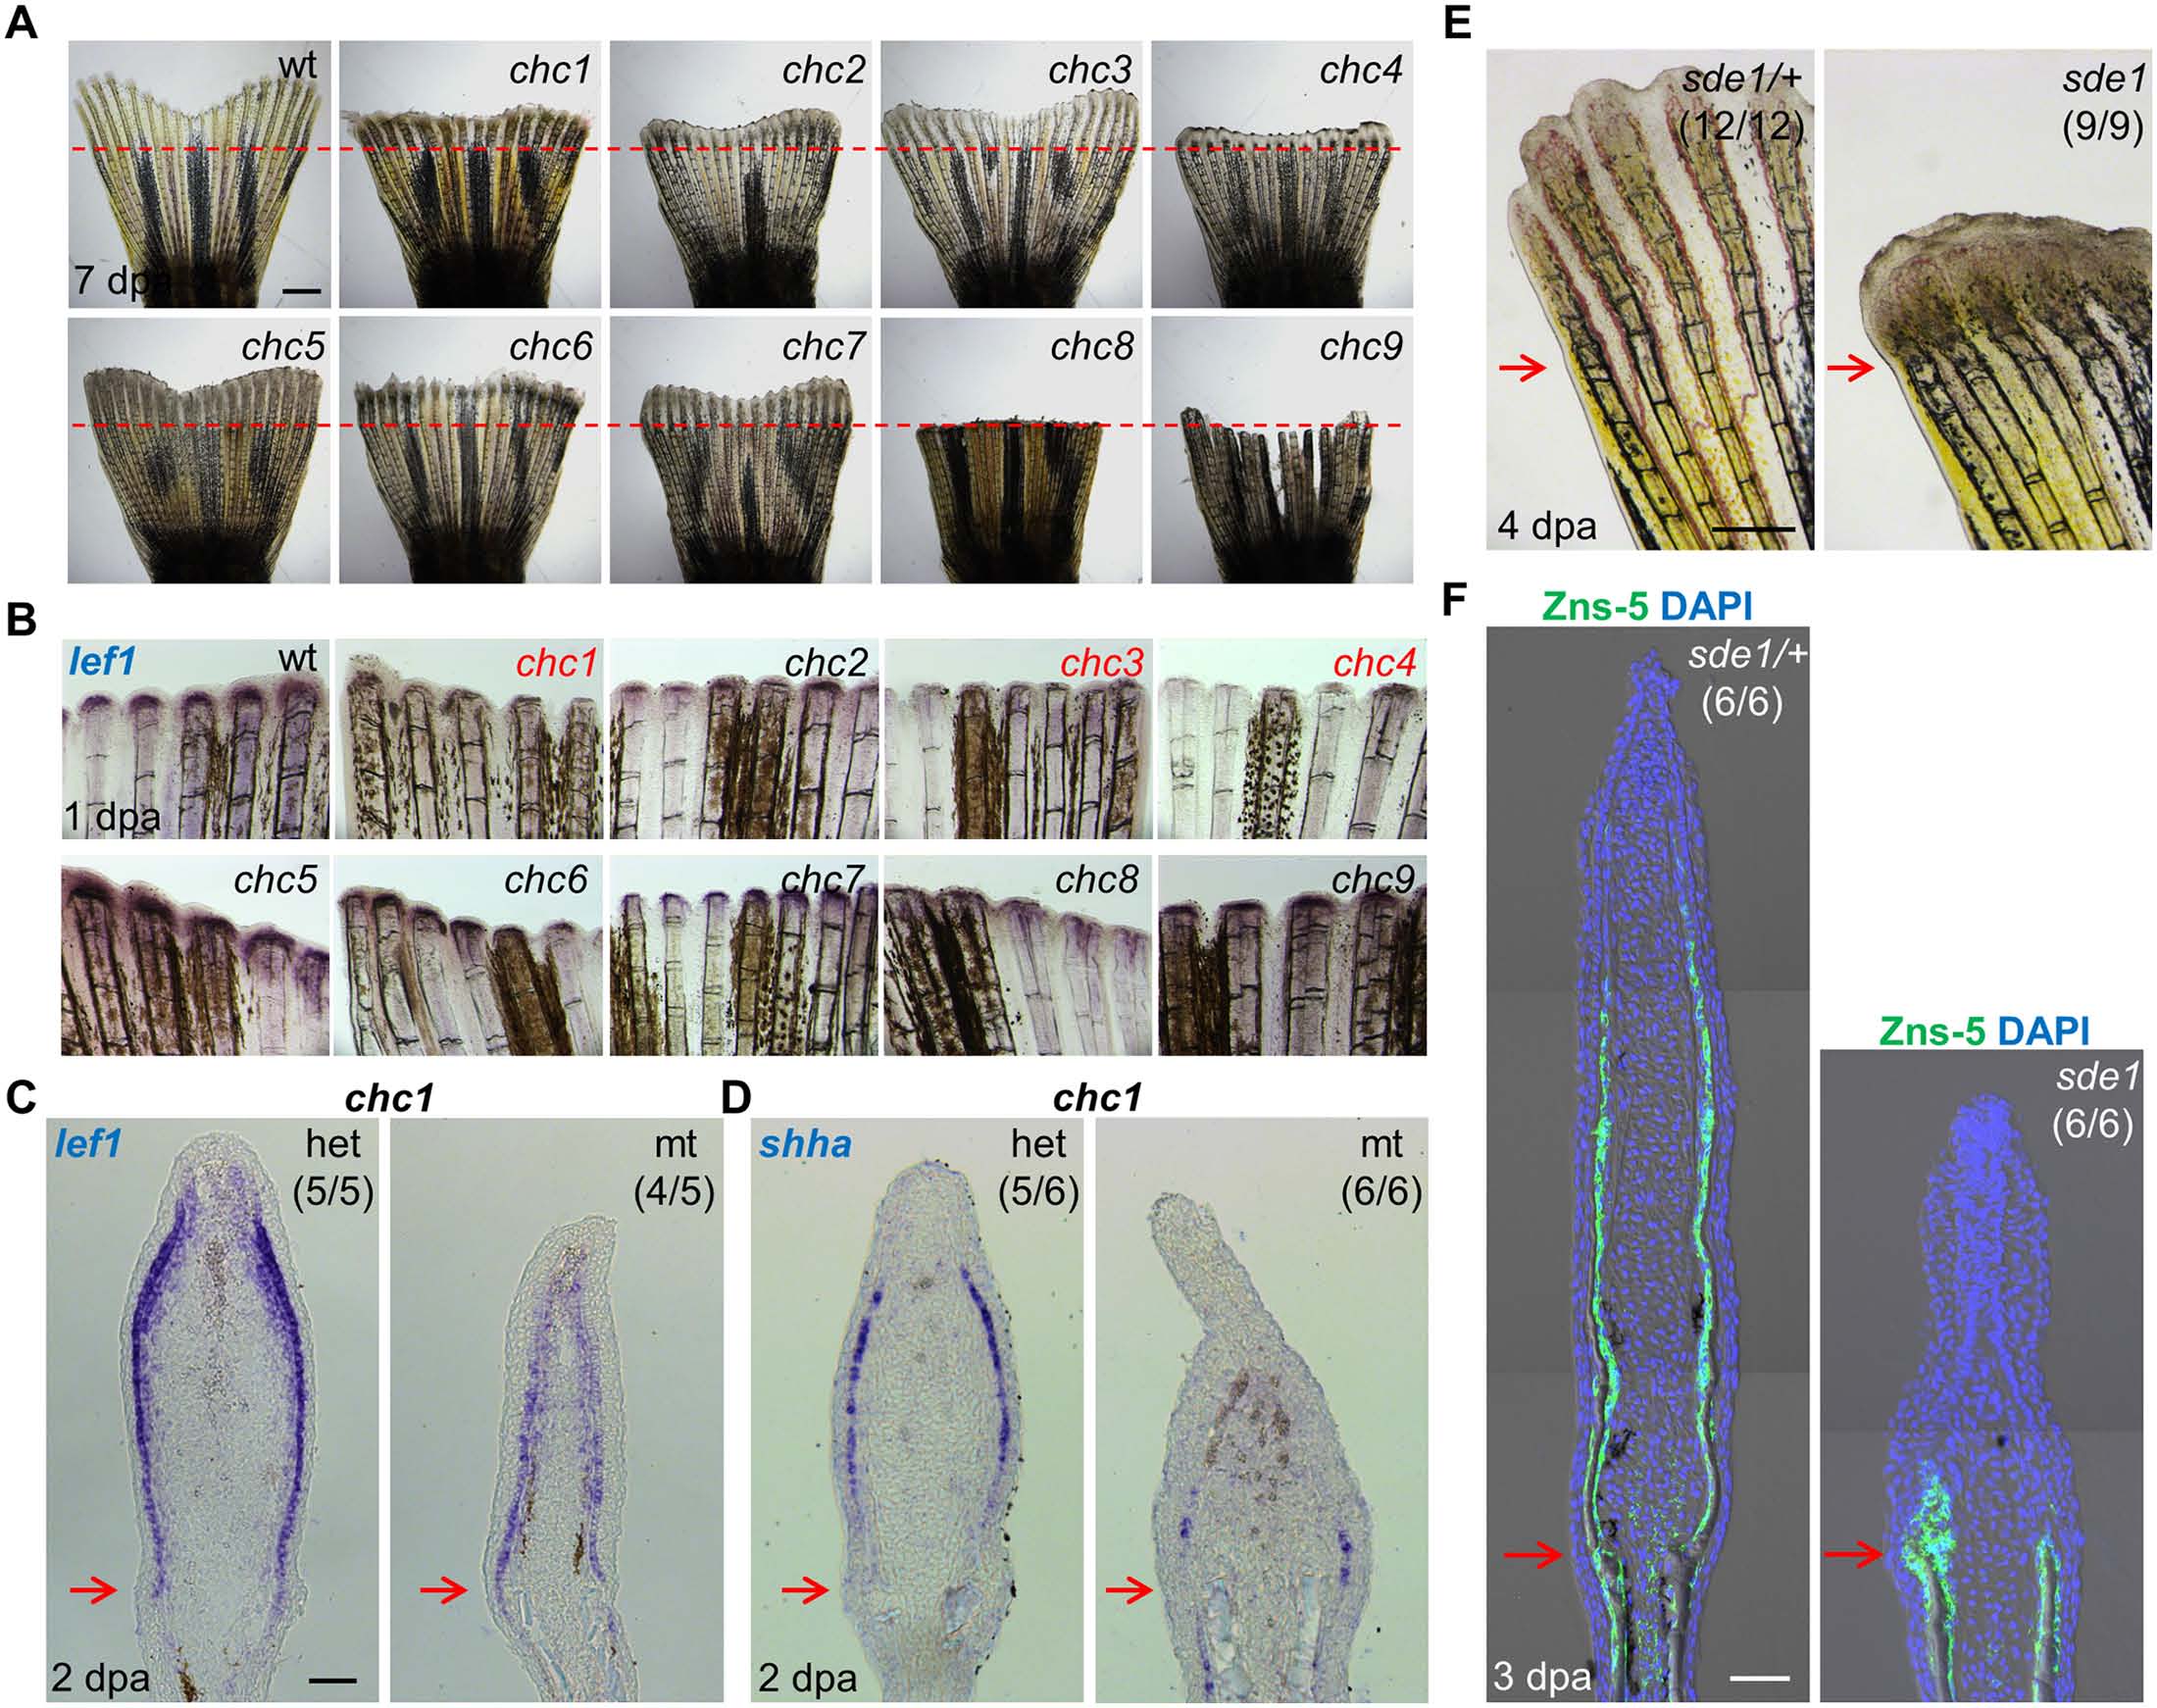
Forward genetic screen for signaling defects in the fin regeneration epidermis.
(A) Whole-mount images of wild-type and (chc1-9) mutant regenerates at 7 days post amputation (dpa). Red dashed lines indicate plane of amputation. Scale bars, 1 mm. (B) Whole-mount RNA ISH of lef1 expression in wild-type and mutant regenerates at 1 dpa. chc1, chc3, and chc4 mutant families show reduced or undetectable lef1 expression when compared to their respective heterozygous siblings. (C, D) Longitudinal sections of 2 dpa fin regenerates assessed by RNA ISH, showing reduced lef1 and shha in chc1 mutant regenerates. (E) Whole-mount images of sde1 (formerly, chc1) fin regenerates at 4 dpa. Scale bars, 0.5 mm. (F) Longitudinal sections of 3 dpa fin regenerates show impaired patterning of osteoblasts in sde1 (chc1) mutants, assessed by Zns-5 antibody staining (green). DAPI, blue. Scale bars, 50 µm (unless otherwise indicated). Red arrows indicate plane of amputation.