
|
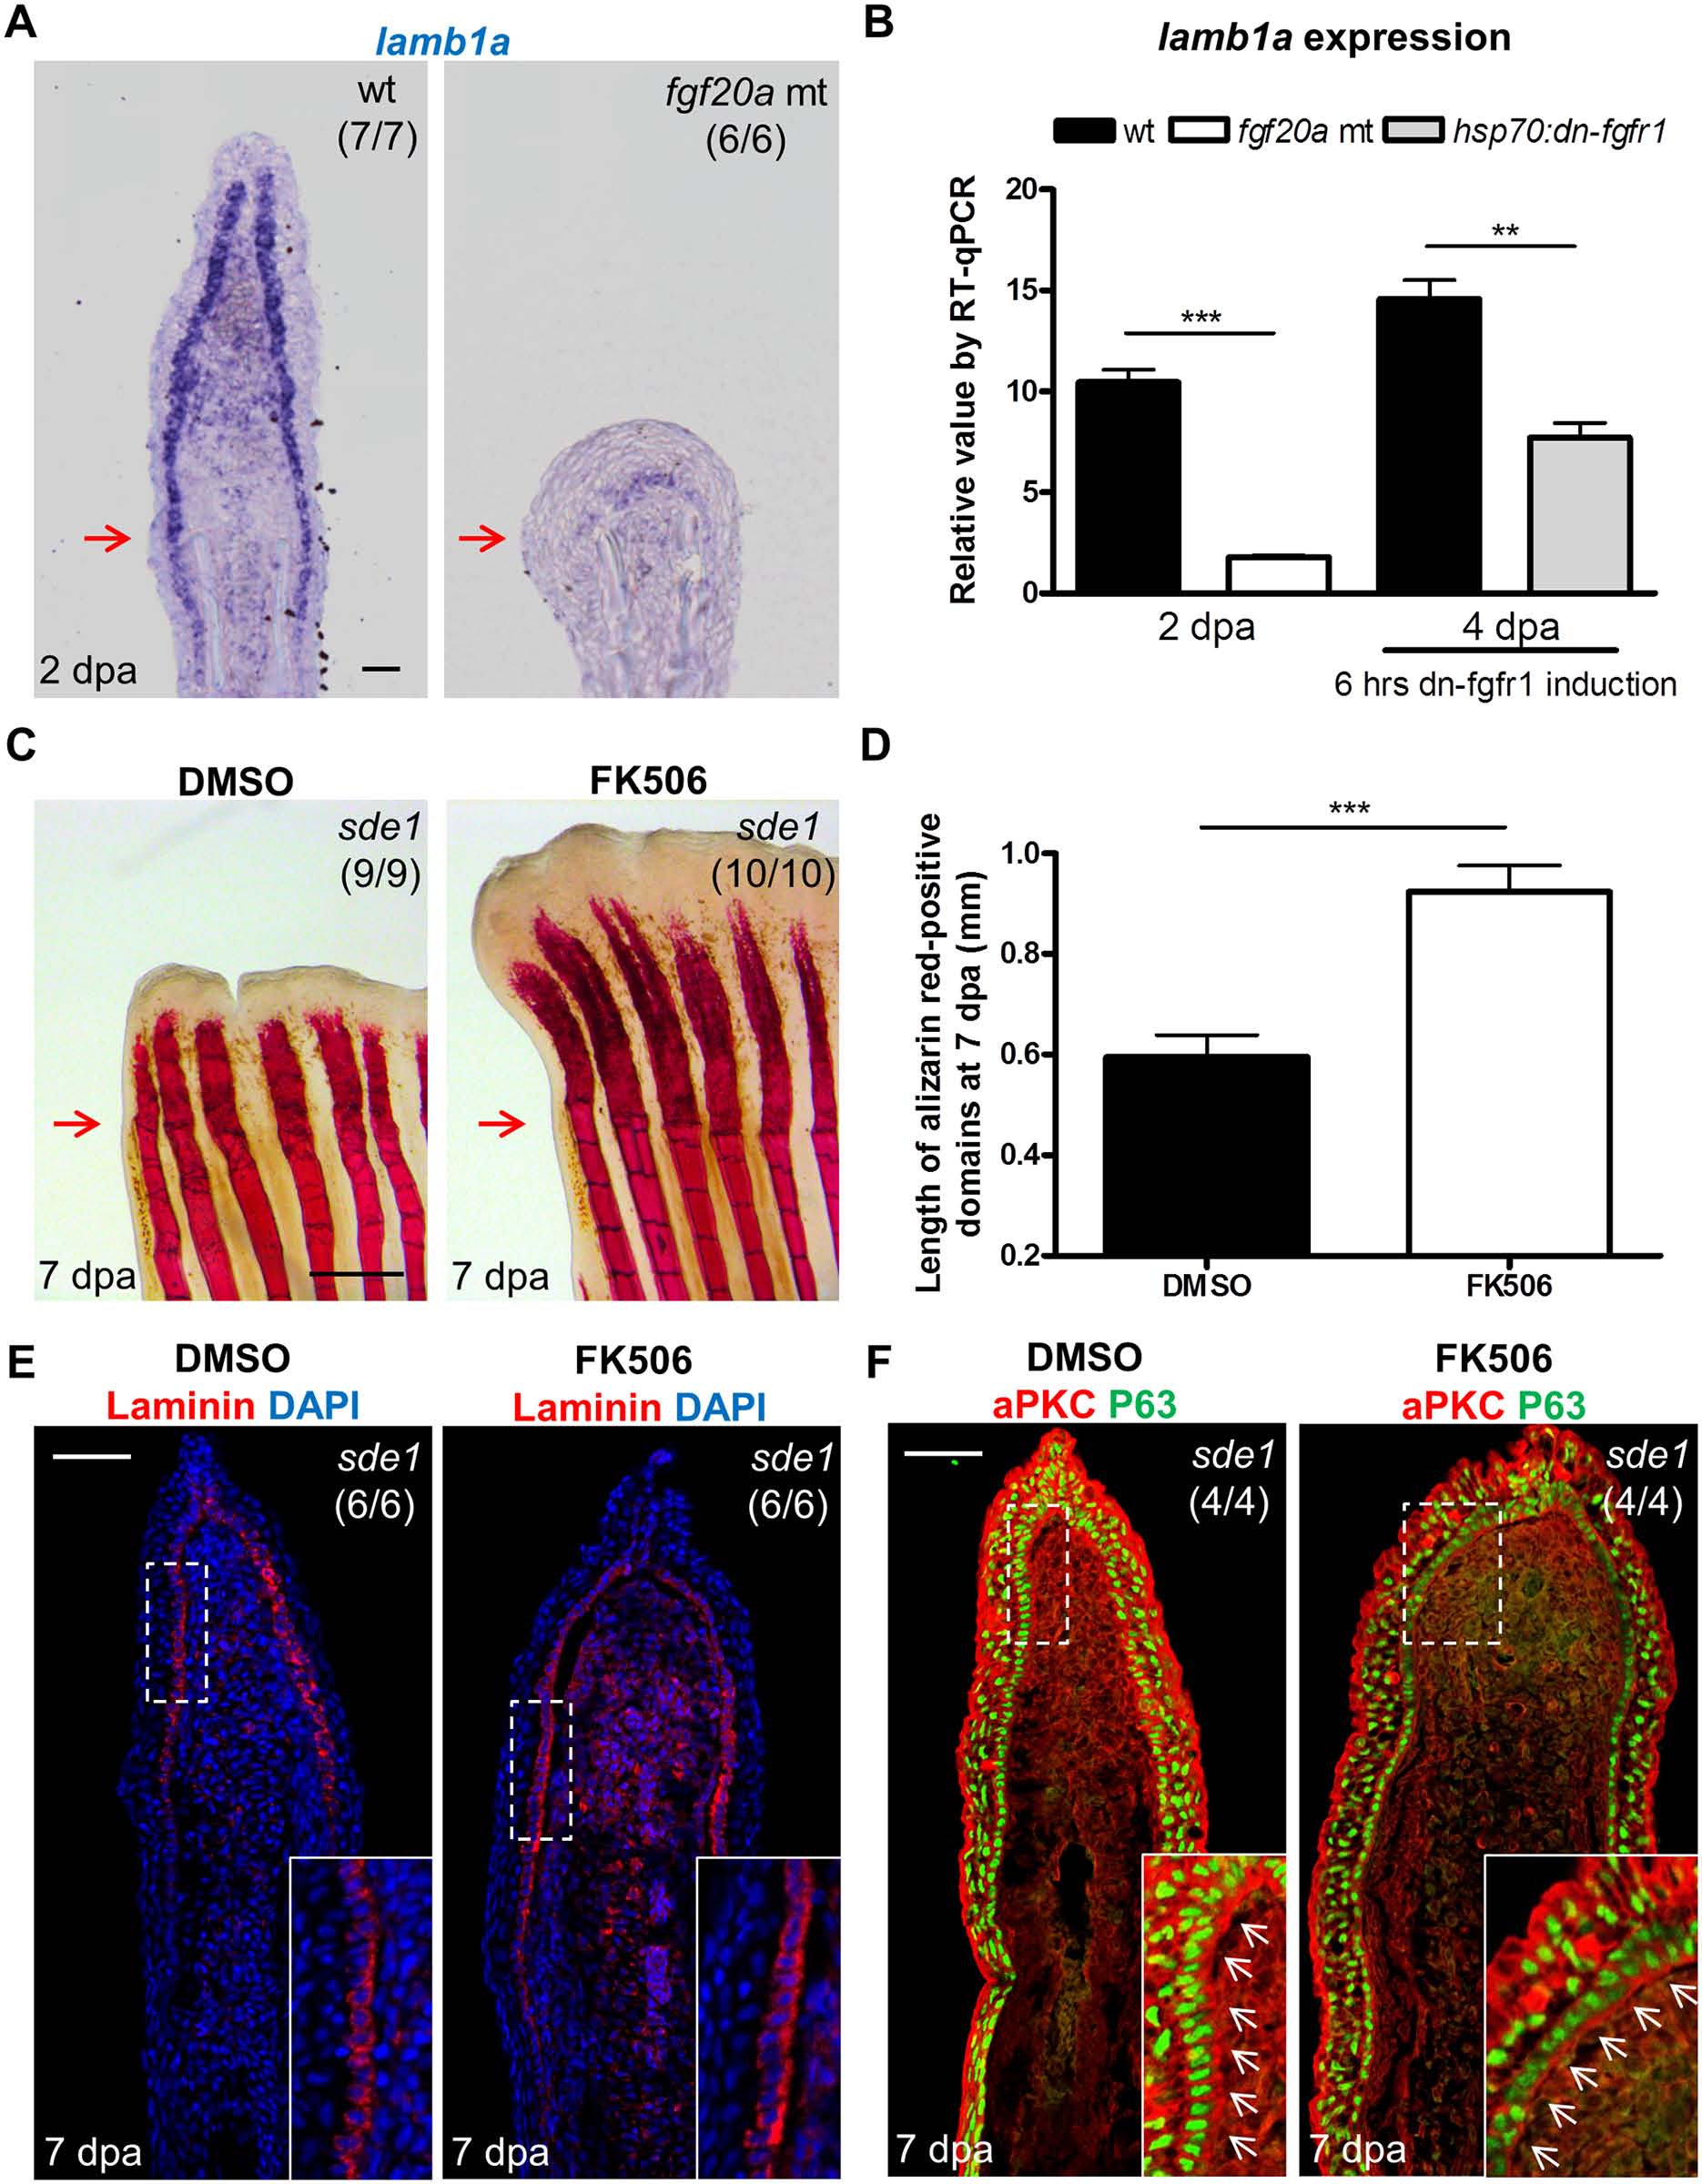
Fig. 7
Association of lamb1a expression and function with key regeneration effector pathways.
(A) Longitudinal sections of 2 dpa fin regenerates stained for lamb1a by ISH, indicating sparse expression in fgf20a mutants (dob). Scale bars, 50 µm. (B) RT-qPCR analysis indicating depleted levels of lamb1a RNA in fgf20a mutants (left). When Fgf signaling is blocked by induced expression of a dominant–negative Fgf receptor for just 6 hours at 4 dpa, lamb1a levels drop by nearly 50%. qPCR results were normalized to rpl13a and to the basal expression of lamb1a at 0 hpa. (n = 4; mean ± SEM; Student’s t -test, ***P < 0.001, **P < 0.01). (C) Whole-mount images of fin regenerates stained by alizarin red staining for calcium deposition, after treatment of sde1 animals with DMSO or FK506. Scale bars, 0.5 mm. (D) Measurement of the length of alizarin red-positive domains at 7 dpa (n = 9 and 10; mean ± SEM; Student’s t -test, ***P < 0.001). (E) Antibody staining for Laminin protein in vehicle- or FK506-treated sde1 fin regenerates at 7 dpa. Laminin, red; DAPI, blue. (F) Antibody co-staining for aPKC (red) and P63 (green) expression in vehicle or FK506-treated sde1 fin regenerates at 7 dpa. FK506 treatment partially rescued bone regeneration in sde1 mutants, with no detectable impact on Laminin localization or basal epithelial cell polarity. Scale bars, 50 µm. White dashed boxes indicate areas of enlarged view. White arrows indicate basal cell nuclei. Red arrows indicate plane of amputation.