
|
Fig. 2
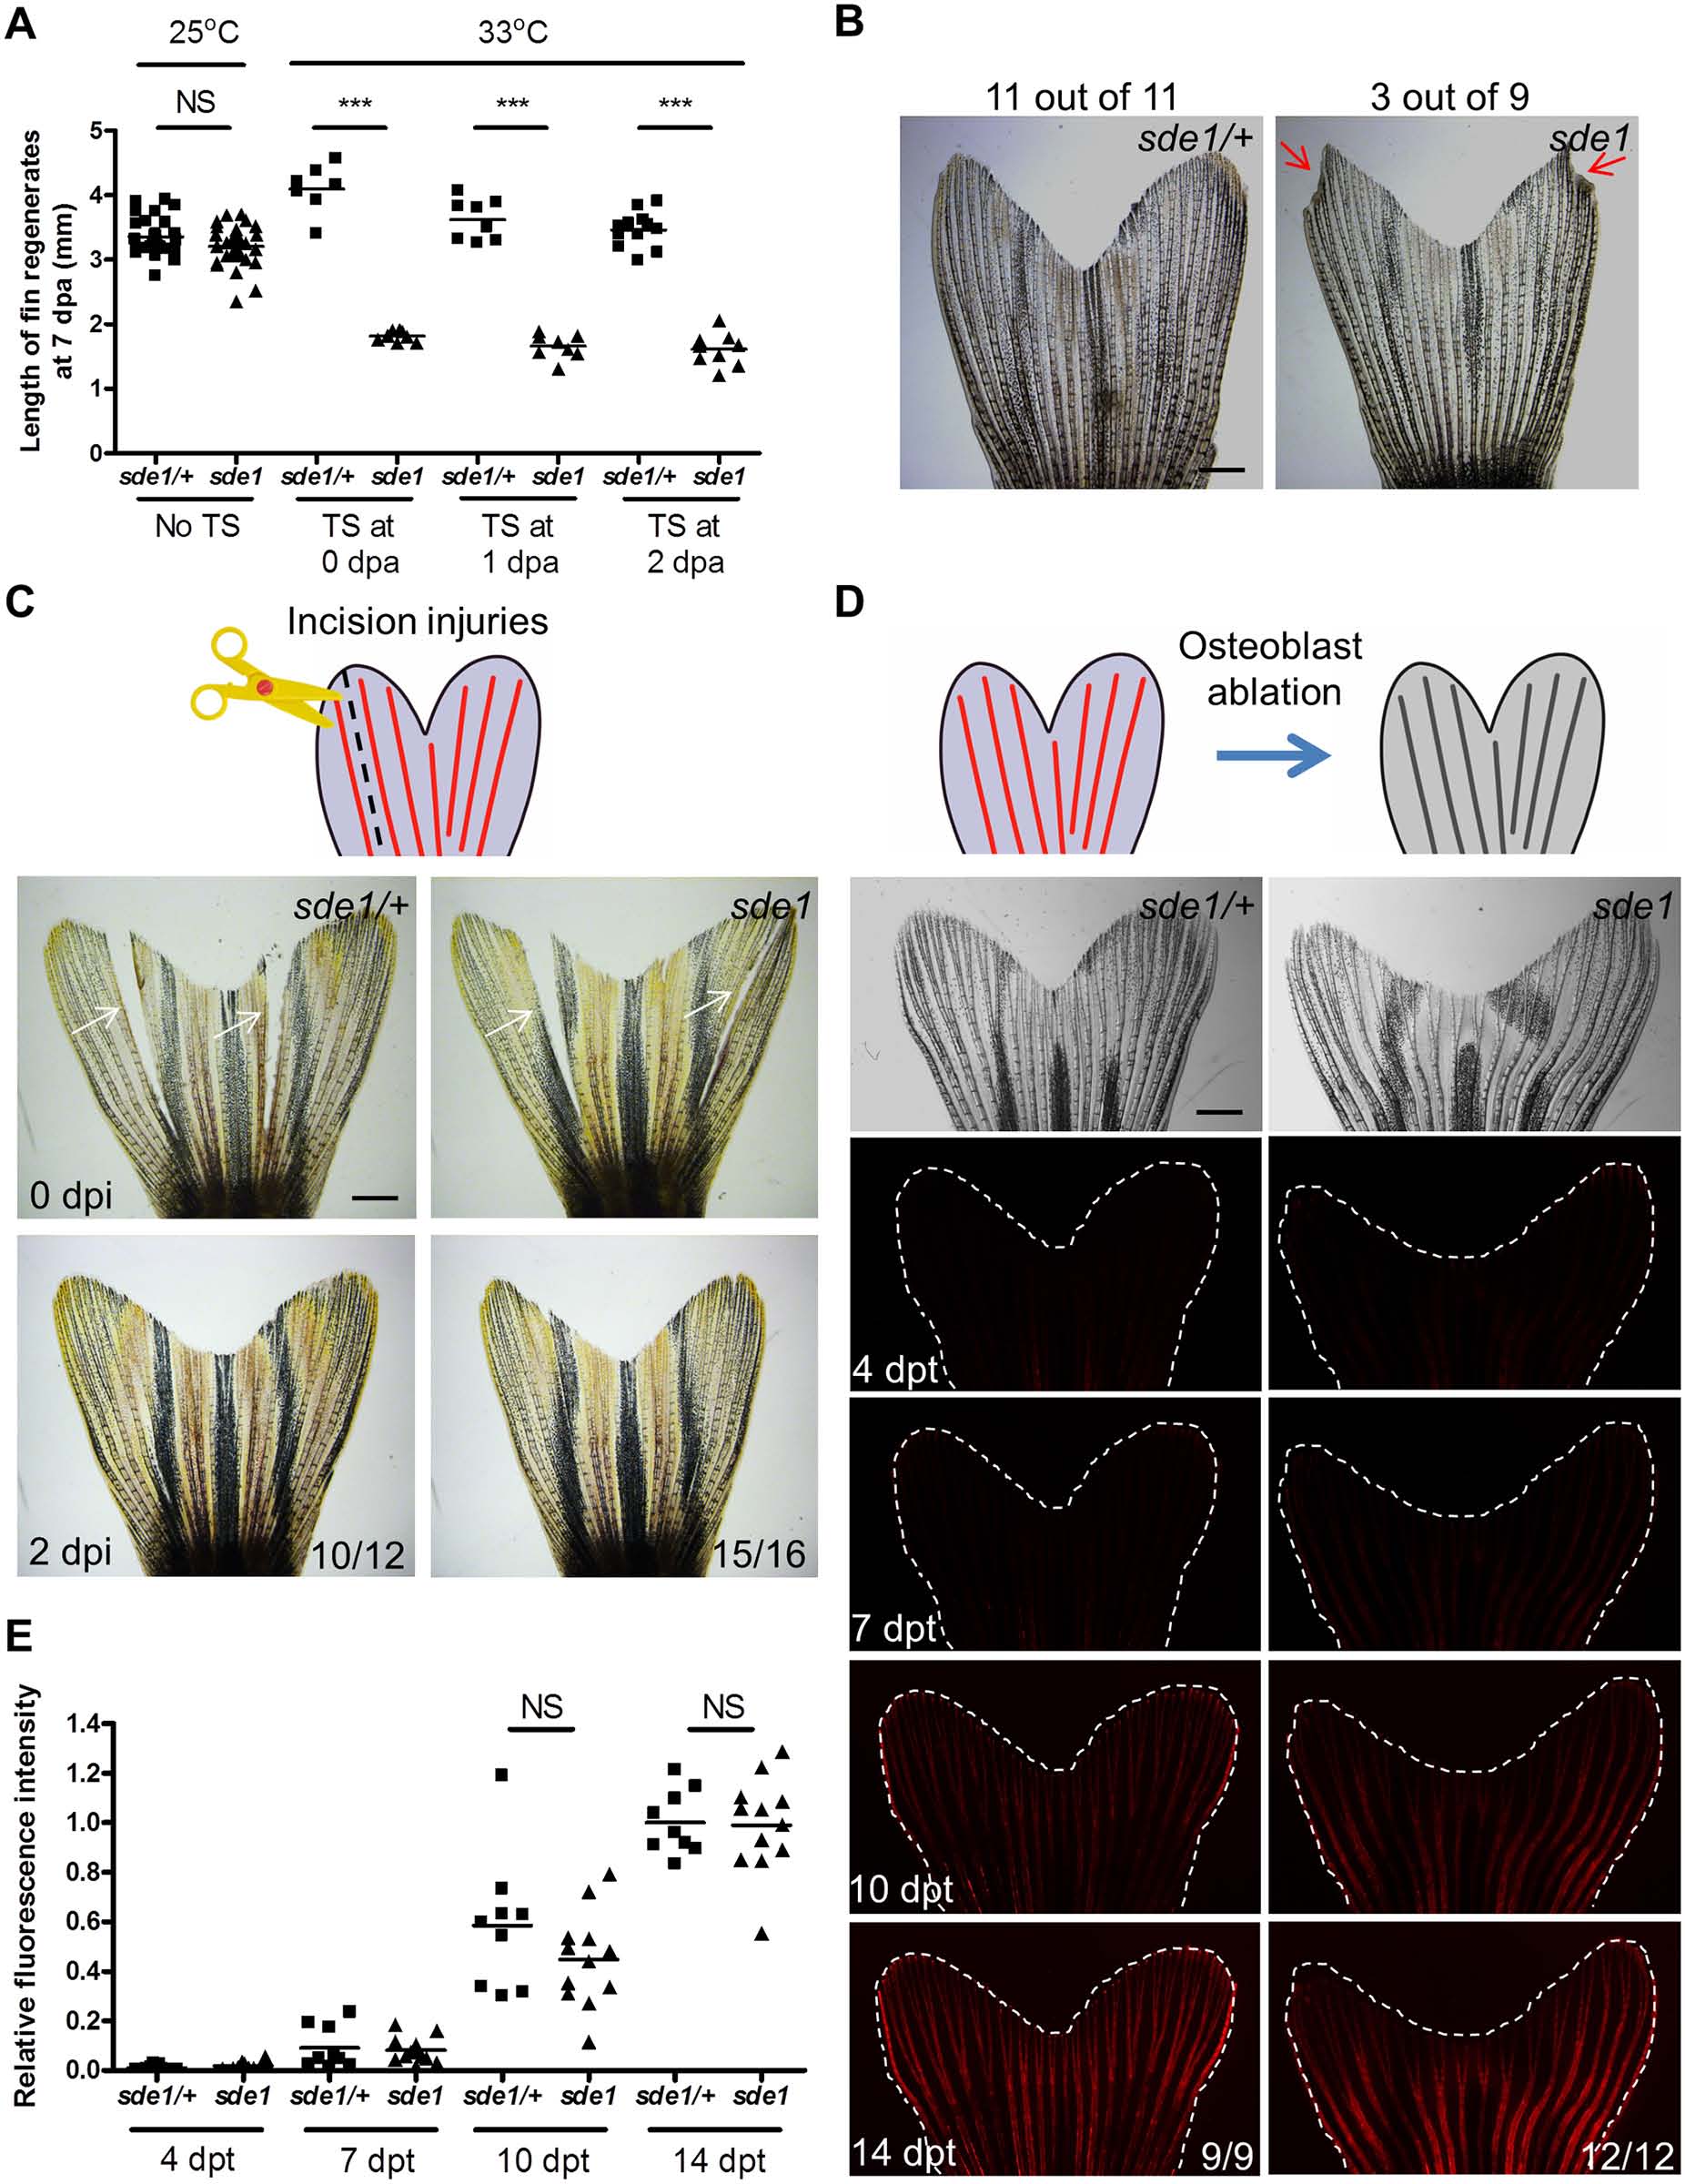
sde1 requirements for tissue regeneration depend on injury context.
(A) Measurement of sde1 fin regenerates at 7 dpa. After amputation, animals were shifted from the permissive temperature (25°C) to the restrictive temperature (33°C) at 0, 1 or 2 dpa. TS, temperature shift. (n = 15, 16, and 21; Student’s t -test, ***P < 0.001; NS, non-significant). (B) Adult sde1/+ and sde1 animals were incubated at 33°C for two months (n = 11 and 9). Red arrows point to a damaged fin edge in sde1. The most severe example of damage in sde1 animals is displayed here (3 of 9 showed damage in the experiment). (C) (Top) Cartoon depicting the model of incision injuries. (Bottom) Whole-mount images were acquired at 0 and 2 days post incision injury (dpi). Images from the same animal are shown before (top) and after repair (bottom). White arrows indicate sites of injury (n = 12 and 16). (D) (Top) Cartoon depicting the model of osteoblast ablation. (Bottom) Fluorescence intensity, indicating recovery of genetically labeled osteoblasts after ablation, was recorded at 4, 7, 10, and 14 days post Mtz treatment (dpt) and quantified using ImageJ software. White dashed lines indicate fin boundaries. Images from the same animal are shown throughout recovery. (E) Quantification of relative fluorescence intensity from individual animals after osteoblasts ablation (n = 9 and 12; mean ± SEM; Student’s t-test; NS, non-significant). Scale bars, 1 mm.