
- Title
-
Liver-Specific Expressions of HBx and src in the p53 Mutant Trigger Hepatocarcinogenesis in Zebrafish
- Authors
- Lu, J.W., Yang, W.Y., Tsai, S.M., Lin, Y.M., Chang, P.H., Chen, J.R., Wang, H.D., Wu, J.L., Jin, S.L., and Yuh, C.H.
- Source
- Full text @ PLoS One
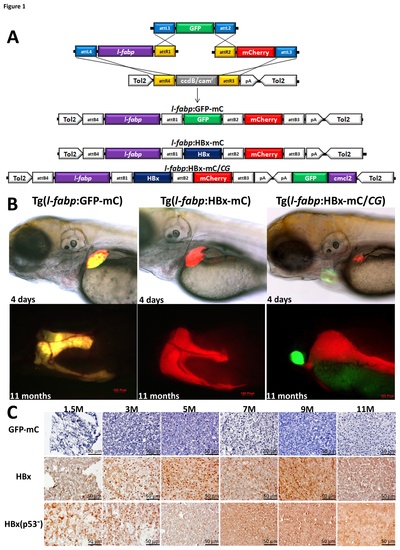
(A) A schematic diagram of the LR recombination reaction used to generate the expression constructs, including three entry clones (p5E-l-fabp, pME-GFP and p3E-mCherry) and two destination vectors (pDestTol2pA and pDestTol2CG2) that contain the cmlc2:GFP-pA expression cassette. The three final constructs are shown at the bottom of the figure. (B) The expression of the GFP-mCherry fusion protein and the HBx-mCherry fusion protein in the liver are shown in four-day-old embryos and eleven-month-old adult wild-type fish harboring the l-fabp:GFP-mCherry transgene and the l-fabp:HBx-mCherry transgene, respectively. The HBx-mCherry fusion protein is expressed in the liver of p53 mutant fish harboring the l-fabp:HBx-mCherry;cmcl2:GFP transgene, as indicated by the red fluorescence, and cmlc2:GFP is expressed in the heart, as indicated by the green fluorescence. (C) HBx protein expression in the hepatocytes was detected via immunostaining of the liver sections of the 1.5-, 3-, 5-, 7-, 9- and 11-month-old fish harboring the l-fabp:HBx-mCherry transgene in the wild-type background or the l-fabp:HBx-mCherry;cmcl2:GFP transgene in the p53 mutant background (x 400). Scale bars: 50 μm. |
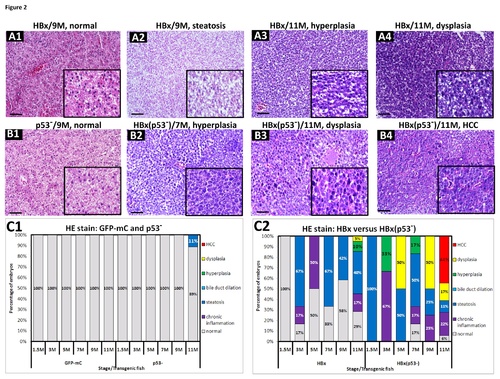
(A1~A4) H&E staining of the liver sections from HBx transgenic fish revealed various pathological phenotypes, such as normal tissue, steatosis, hyperplasia and dysplasia. (B1) H&E staining of the liver sections from p53 mutant fish appeared normal. (B2~B4) H&E staining from the liver sections of HBx(p53-) transgenic fish revealed hyperplasia, dysplasia and HCC. All specimens are shown under 200-fold magnification. Scale bars: 50μm. The boxed areas are enlarged images with 400-fold magnification and are shown in the lower right corner. (C1) Statistical analysis of H&E staining results from GFP-mC and p53 mutant control fish. (C2) Statistical analysis of H&E staining results from HBx and HBx(p53-) transgenic fish. The different colors denote the different pathological features, as follows: gray-normal, purple-chronic inflammation, blue-steatosis, light blue-bile duct dilation, green-hyperplasia, yellow-dysplasia, and red-HCC, respectively. PHENOTYPE:
|
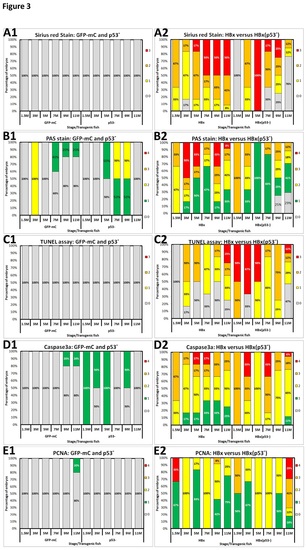
Comparison of the histopathology of hepatocytes among wild-type and p53 mutant fish overexpressing HBx or src from 1.5 to 11 months of age.(A) Liver fibrosis was determined by Sirius Red staining. (B) Glycogen accumulation was identified by periodic acid-Schiff (PAS) staining. (C) Apoptosis was examined using the TUNEL assay. (D) Activated caspase 3a was detected by IHC staining. (E) Nuclear PCNA expression was assessed using IHC staining. For each figure, panel 1 represents GFP-mC and p53 mutant control fish, and panel 2 represents HBx and HBx(p53-) transgenic fish. The different colors denote different scores. For A and C, there are four scores in total, as follows: gray-0, yellow-1, orange-2, and red-3. For B, D and E, there are five scores in total, as follows: gray-0, green-1, yellow-2, orange-3, and red-4. PHENOTYPE:
|
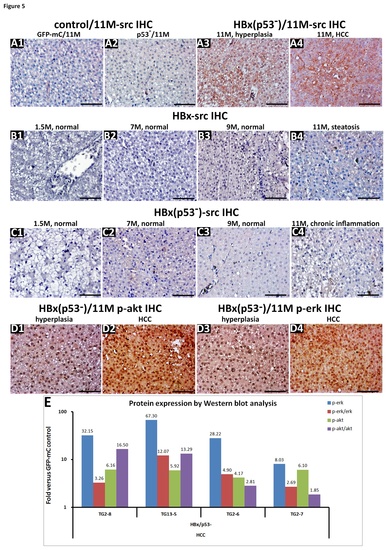
(A) Immunohistochemical analysis of src protein expression in hepatocytes from the GFP-mC and p53 mutant control fish and HBx(p53-) transgenic fish at 11 months. (B) src IHC results from HBx transgenic fish at 1.5, 7, 9 and 11 months. (C) src IHC results from HBx(p53-) transgenic fish at 1.5, 7, 9 and 11 months. (D) Immunohistochemical detection of phosphorylated ERK and phosphorylated AKT in 11-month-old Tg(l-fabp:HBx-mCherry;cmcl2:GFP) transgenic fish with hyperplasia and HCC (x 400). Scale bars: 50 μm. (E) Western blot analysis for the activation of erk and akt in the livers of transgenic fish at different stages of HCC development. After measuring the band intensity using the UVP VisionWorks LS software, the relative density was normalized to β–actin. The ratios of p-erk/erk and p-akt/akt were analyzed, and the data are expressed as fold changes of HBx(p53-) transgenic fish relative to GFP-mC controls. |
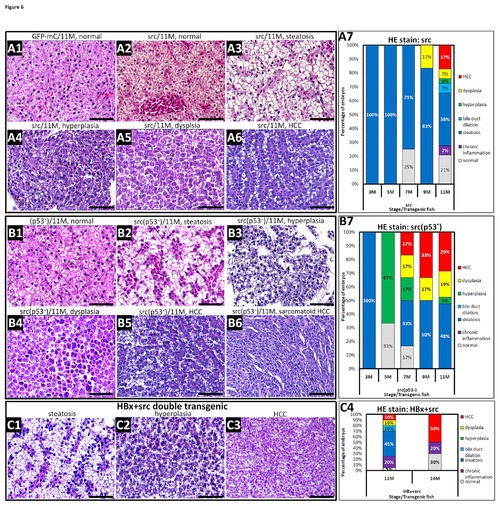
(A1) H&E staining of liver sections from wild-type fish revealed normal histology at 11 months. (A2~A6) H&E staining of liver sections from src-overexpressing, wild-type fish displayed steatosis, hyperplasia, dysplasia and HCC at 11 months. (B1) H&E staining of liver sections from the p53 mutant fish showed normal features at 11 months. (B2~B6) H&E staining of liver sections from src(p53-) transgenic fish showed severe steatosis and chronic inflammation, dysplasia, HCC and sarcomatoid HCC at 11 months. (C) The hepatocytes from the double transgenic line overexpressing HBx and src in a wild-type background exhibit steatosis, chronic inflammation, hyperplasia, and HCC. All sections were stained with H&E and photographed at 400X magnification. Scale bars: 50 μm. A7, B7, and C4 show the statistical analysis of the H&E staining results. The following different colors denote the different pathological features: gray-normal, purple-chronic inflammation, blue-steatosis, light blue-bile duct dilation, green-hyperplasia, yellow-dysplasia, and red-HCC. PHENOTYPE:
|
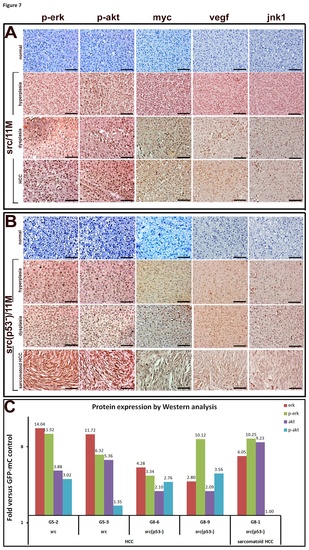
Immunohistochemical analyses of phosphorylated erk1/2 (p-erk), phosphorylated akt (p-akt), myc, vegf and jnk1 were performed in liver sections prepared from src-overexpressing wild-type zebrafish (A) or p53 mutant zebrafish (B) that displayed hyperplasia, dysplasia, HCC and sarcomatoid HCC (x 400). GFP-mCherry transgenic fish that were 11 months of age were used as controls and are shown in the first row of each panel. Scale bars: 50 μm. (C) Western blot analysis for the activation of erk and akt in the livers of transgenic fish at different stages of HCC development. After measuring the band intensity using the UVP VisionWorks LS software, the relative density was normalized to β–actin. Ratios of p-erk/erk and p-akt/akt were analyzed, and the data are expressed as relative fold changes for src or src(p53-) transgenic fish relative to GFP-mC controls. |
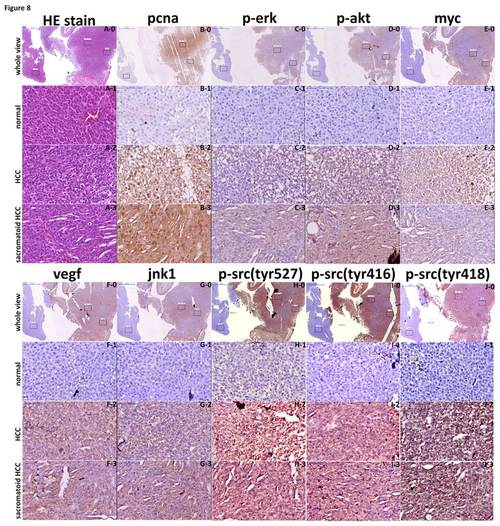
Assessment of pcna, p-erk, p-akt, myc, vegf, jnk1, p-src(tyr527), p-src(tyr416), and p-src(tyr418) signaling in HCC, sarcomatoid HCC, and adjacent normal tissue of src-overexpressing transgenic zebrafish. Liver sections from the src-overexpressing transgenic zebrafish that had developed HCC and sarcomatoid HCC, as well as adjacent normal tissue, were analyzed with H&E staining (A) and immunostaining for pcna, p-erk, p-akt, myc, vegf, jnk1, p-src(tyr527), p-src(tyr416), and p-src(tyr418) (B~J). All slides, comprising normal tissue (1), HCC (2) and sarcomatoid HCC (3), were analyzed using Panoramic Viewer under lower resolution (0) and subsequently at higher resolution. (A0-A3) H&E stain, (B0~B3) pcna protein expression, (C0~C3) p-erk expression level, (D0~D3) p-akt expression level, (E0~E3) myc protein expression, (F0~F3) vegf protein expression, (G0~G3) jnk1 protein expression, (HG0~H3) p-src(tyr527) level, (I0~I3) p-src(tyr416) level, and (J0~J3) p-src(tyr418) expression level were assessed. Scale bars: 50 μm. |
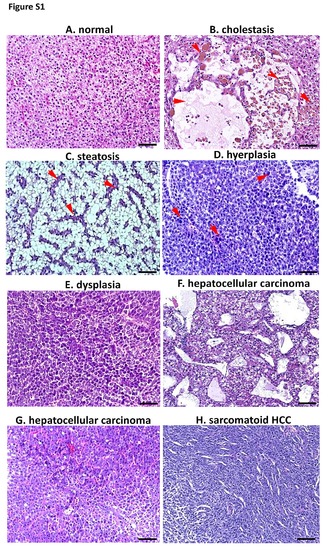
Typical histological features of liver of HBx and src transgenic fish (B-H) in comparison with these of GFP-mCherry transgenic fish. (A) Liver of GFP-mCherry transgenic fish. Normal liver tissue cells arranged in neat rows, the size of the nucleus are similar, and the nuclear-cytoplasmic ratio is not too high. (B) Cholestasis: deposition yellow-green globular bilirubin pigment, arrows indicated bile and spongy vacuoles. (X200). (C) Steatosis: prominent vacuoles in the cytoplasm of hepatocytes, arrows indicated lipid droplets formed by the vacuoles. (X200). Hyperplasia and dysplasia was based on the degree of cell proliferation, also consider the whole area overall differentiation and cell differentiation, such as nuclear-cytoplasmic ratio etc. (D) Hyperplasia: disordered proliferation of atypical hepatocytes with enlarged and mildly irregular nuclei, arrows indicated single or several larger cells with higher nuclear-cytoplasmic ratio compared to surrounding adjacent normal cells (X200). (E) Dysplasia: transformed cells with enlarged nuclei and prominent nucleoli. (X200). Hepatoma cell morphology differs in texture due to the degree of differentiation, such as poorly differentiated, well differentiated, moderately differentiated etc. (F) Hepatocellular Carcinoma (HCC): hepatocellular carcinoma with marked cystic degeneration (spongiosis hepatis) (X200). (G) Hepatocellular Carcinoma (HCC): severe sheets of tumor cells with enlargement polymorphic nuclei and prominent nucleoli. (X200). (H) Sarcomatoid HCC: pleomorphic spindle tumor cells growing in haphazardly fascicular patterns. (X200). |
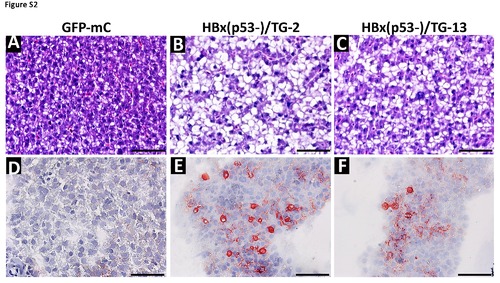
Oil-red staining proved the prominent vacuoles in the cytoplasm of hepatocytes of transgenic fish exhibited lipid accumulation. (A~C) The liver samples from GFP-mC control fish and two strains of HBx transgenic fish in p53 mutant background were stained with hematoxylin-eosin after paraffin embedding. (D~E) The same liver were frozen and stained with oil red O indicated the lipid accumulated in the vacuoles in the hepatocytes. (x 400). Scale bars: 50μm. |
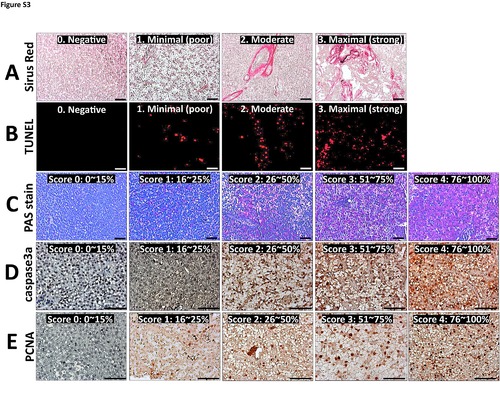
Scoring standard various staining. (A) Sirius Red stain (x 200), (B) TUNEL assay (x 200), (C) PAS staining (x 200), (D) caspase 3 stain (x 400) and (E) nuclear PCNA stain (x 400). Scale bars: 50μm. |
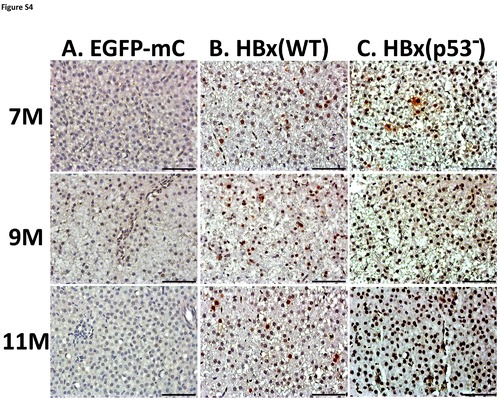
Representative images of PCNA staining in HBx overexpression transgenic fish. (A) EGFP-mCherry transgenic fish, (B) HBx overexpression in wild-type, or (C) HBx overexpression in p53 mutant transgenic fish stained with PCNA antibody 7, 9 and 11 months (x 400).Scale bars: 50μm. |
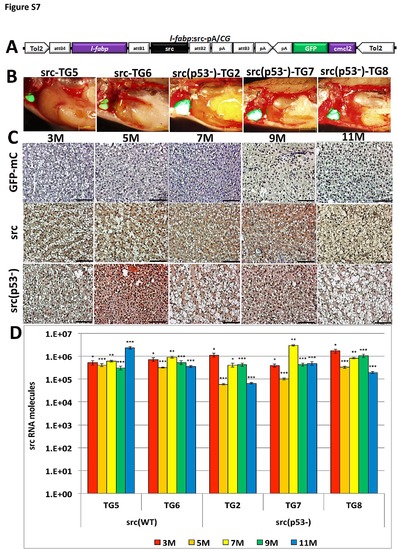
Generation and characterization of Tg (l-fabp:src-mC/CG) transgenic zebrafish. (A) Diagram of the l-fabp:src-mC/CG construct used in this study, containing Tol2 sequences, and the cmlc2:GFP expression cassette. (B) The src protein was expressed in the liver of wild-type and p53 mutant fish carrying the l-fabp:src-mC/CG transgene, as indicated by the cmlc2:GFP was expressed in the heart, as indicated by the green fluorescence. (C) (x 200) Immunohistochemical and (D) quantitative RT-PCR analysis of the expression of the src in hepatocytes from the 3, 5, 7, 9 and 11month old wild-type and p53 mutant fish overexpressing src and control l-fabp:GFP-mC transgenic fish. Scale bars: 50μm. EXPRESSION / LABELING:
|