
|
Fig. 3
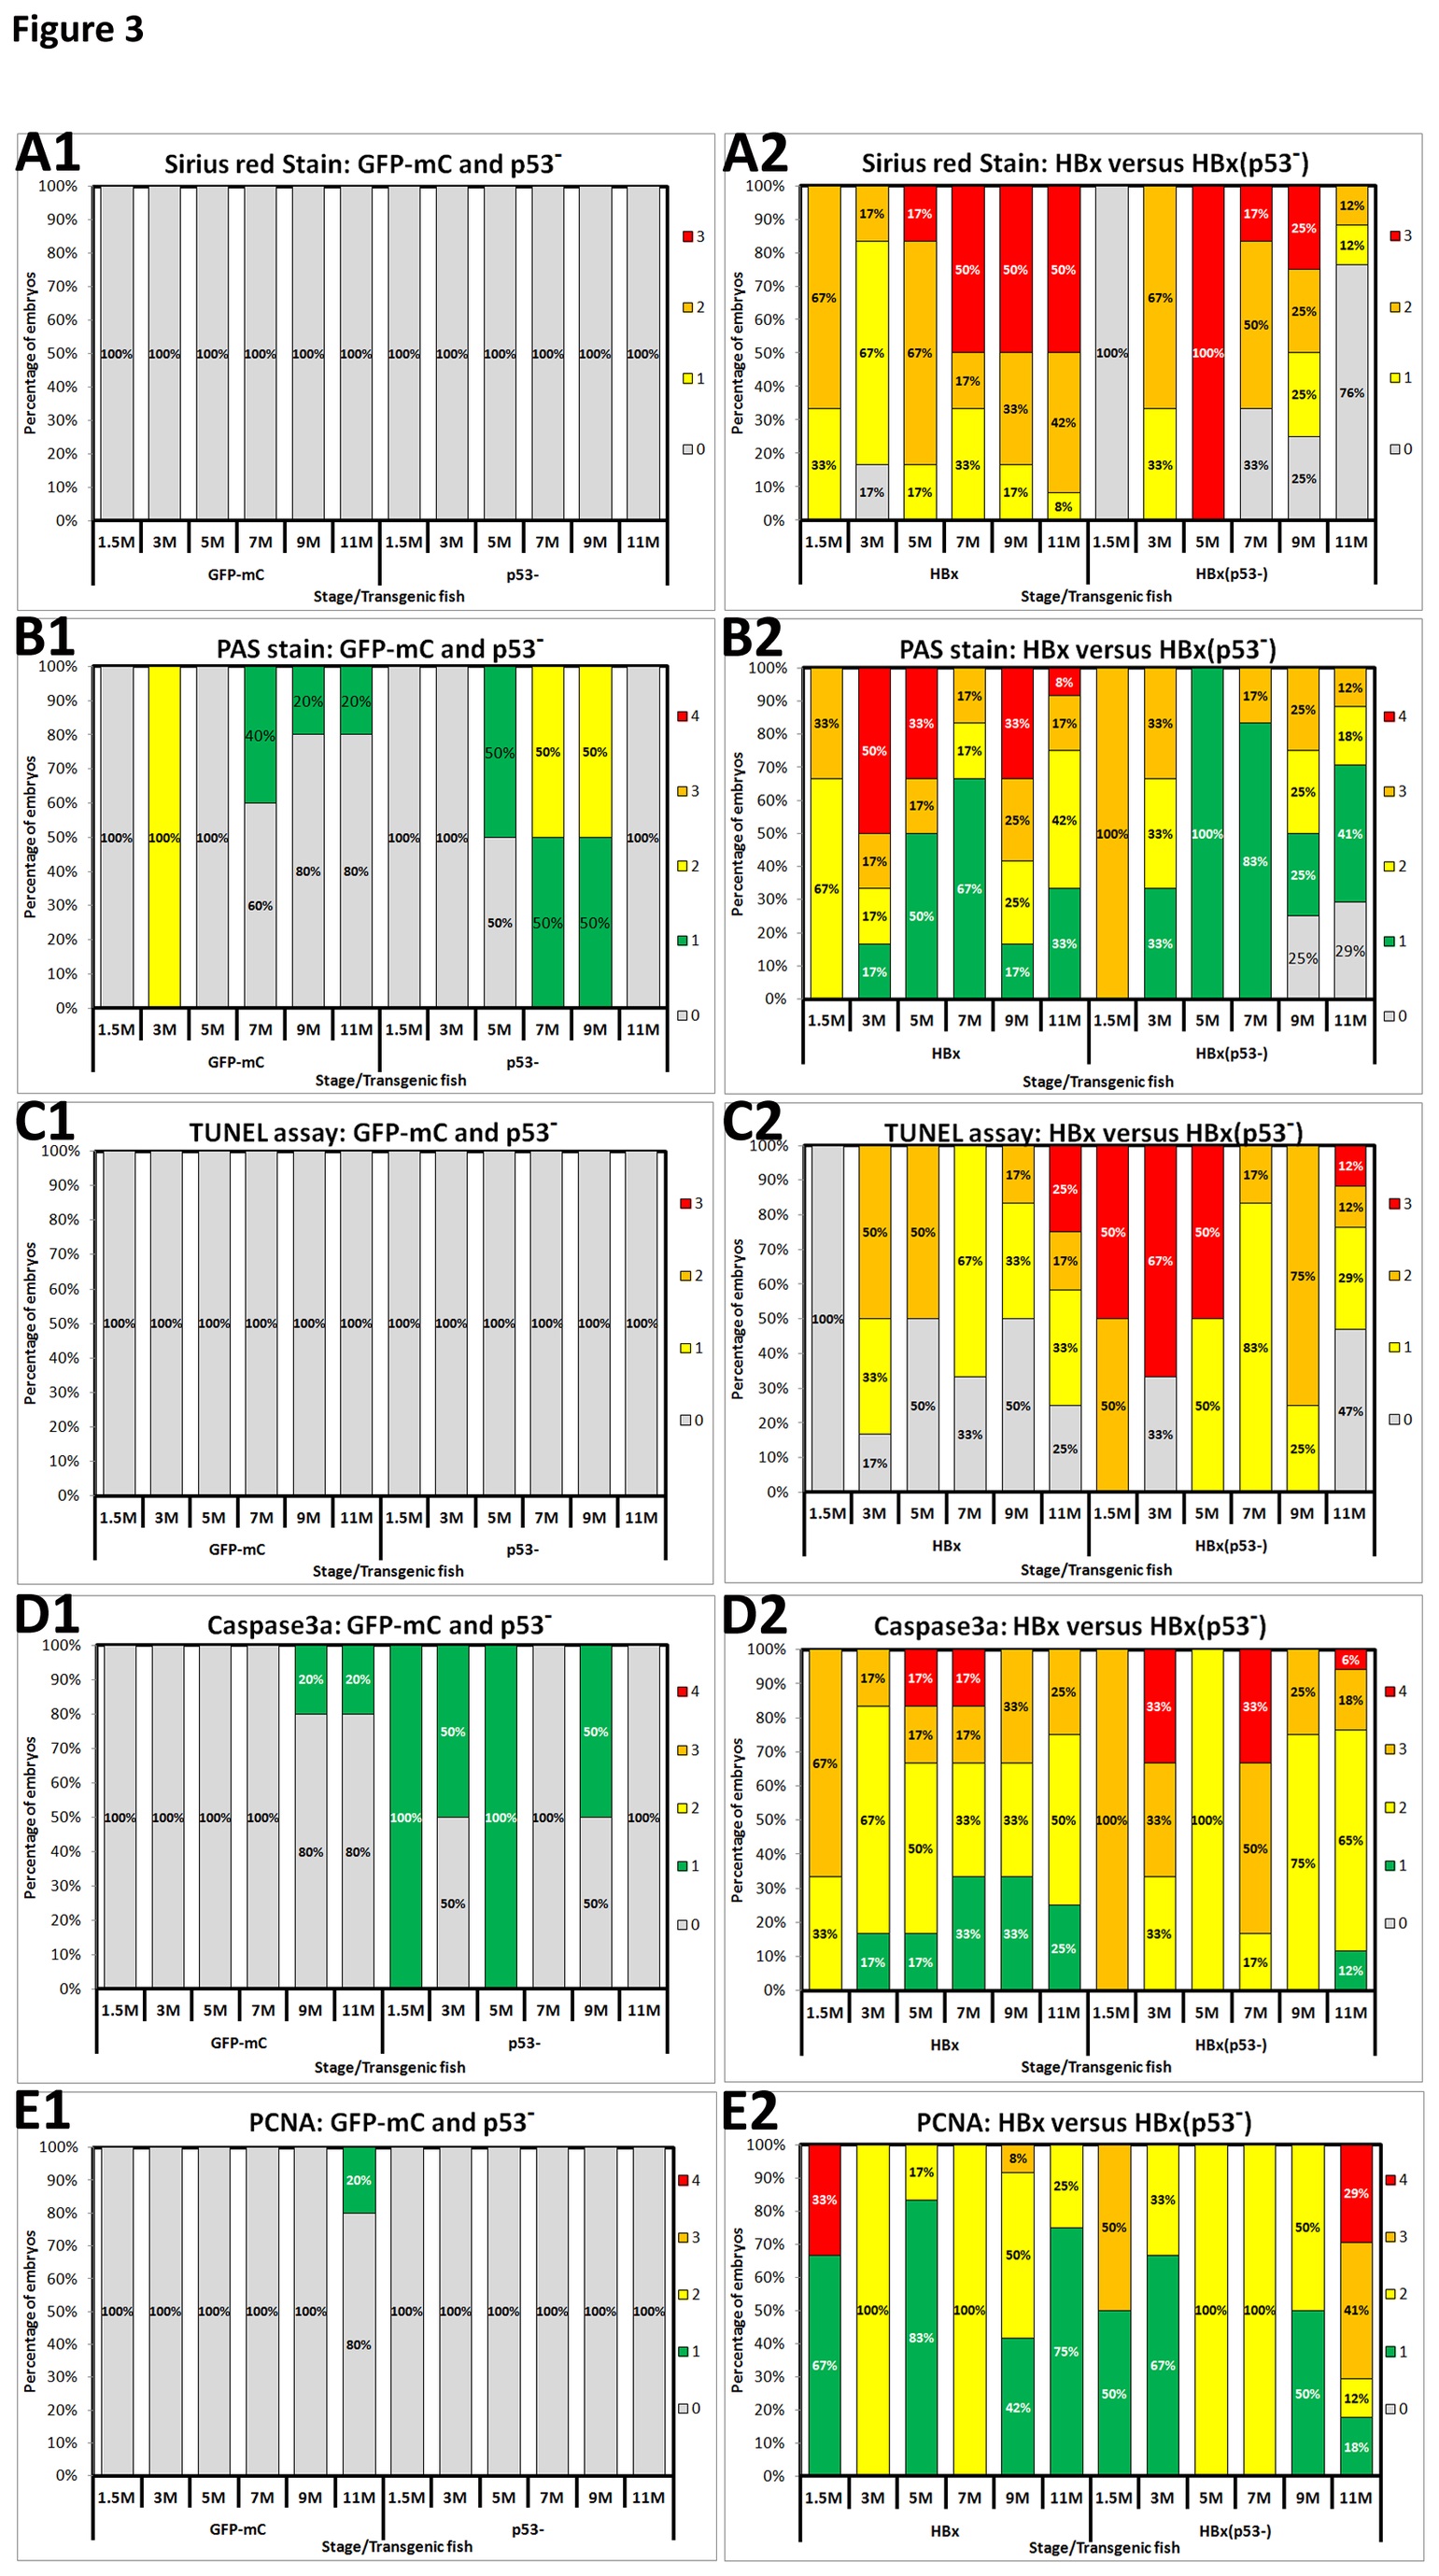
Comparison of the histopathology of hepatocytes among wild-type and p53 mutant fish overexpressing HBx or src from 1.5 to 11 months of age.(A) Liver fibrosis was determined by Sirius Red staining. (B) Glycogen accumulation was identified by periodic acid-Schiff (PAS) staining. (C) Apoptosis was examined using the TUNEL assay. (D) Activated caspase 3a was detected by IHC staining. (E) Nuclear PCNA expression was assessed using IHC staining. For each figure, panel 1 represents GFP-mC and p53 mutant control fish, and panel 2 represents HBx and HBx(p53-) transgenic fish. The different colors denote different scores. For A and C, there are four scores in total, as follows: gray-0, yellow-1, orange-2, and red-3. For B, D and E, there are five scores in total, as follows: gray-0, green-1, yellow-2, orange-3, and red-4.