
Fig. 7
|
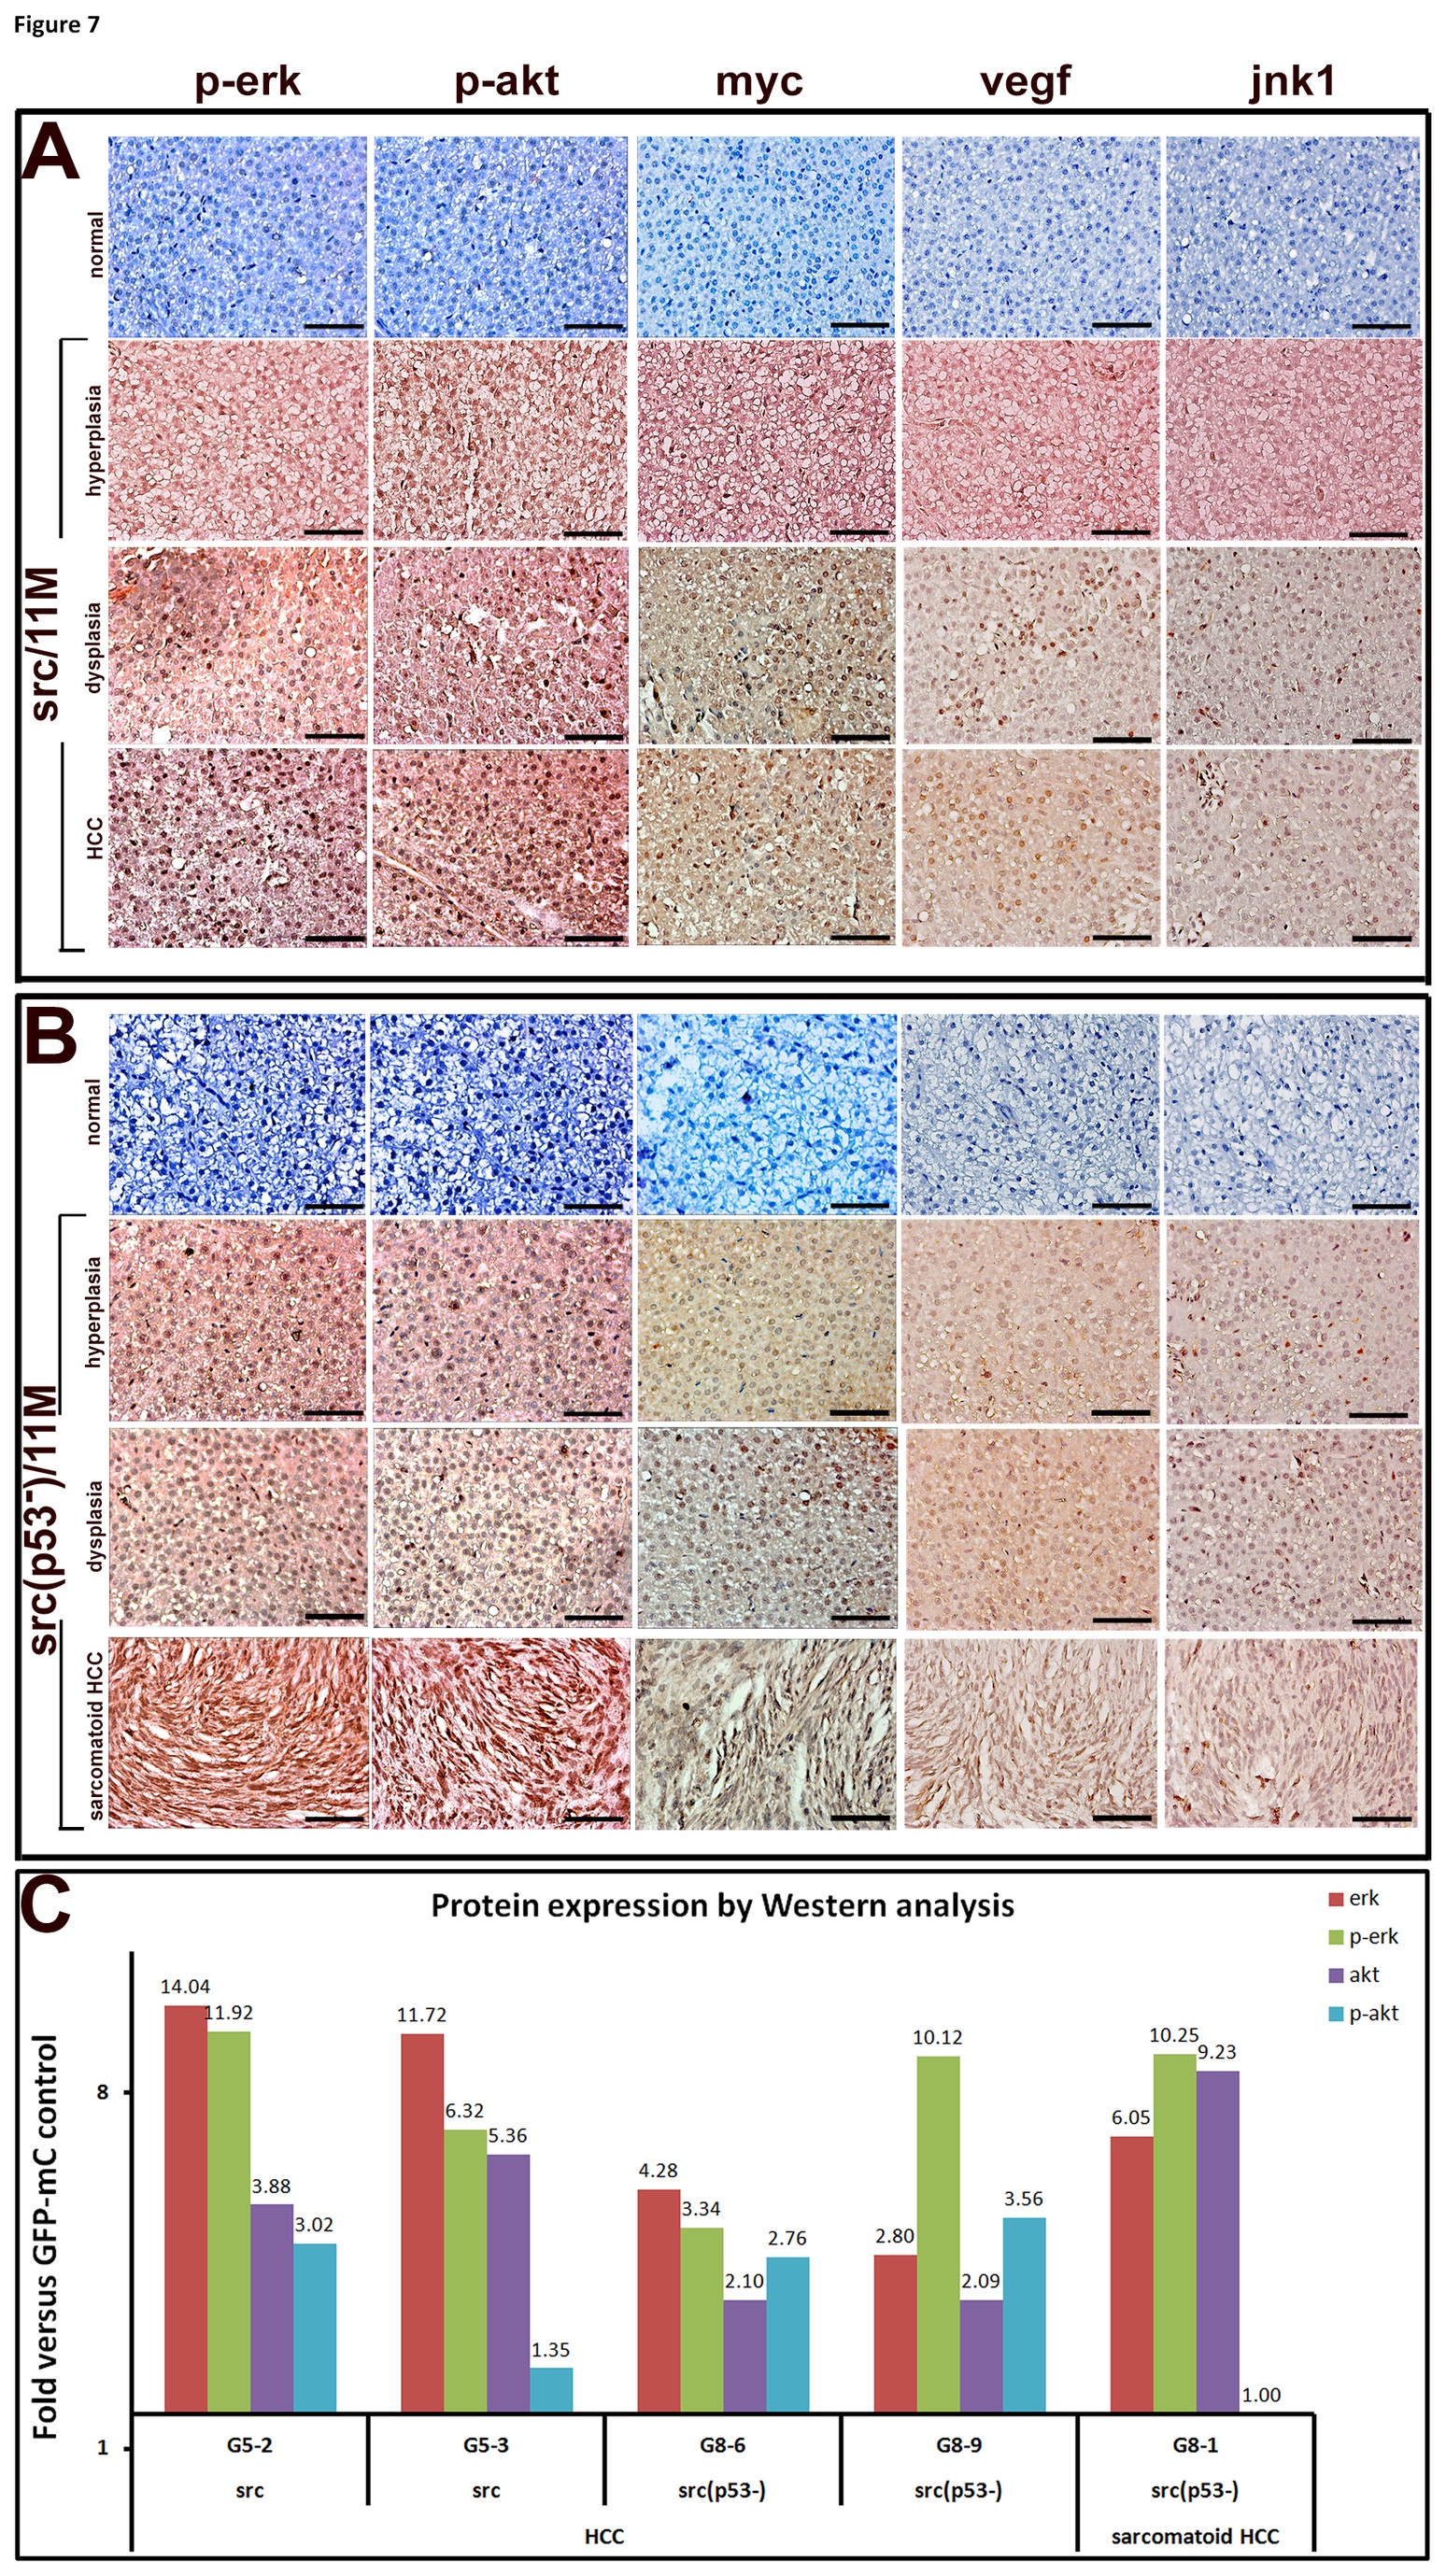
Fig. 7
Immunohistochemical analyses of phosphorylated erk1/2 (p-erk), phosphorylated akt (p-akt), myc, vegf and jnk1 were performed in liver sections prepared from src-overexpressing wild-type zebrafish (A) or p53 mutant zebrafish (B) that displayed hyperplasia, dysplasia, HCC and sarcomatoid HCC (x 400). GFP-mCherry transgenic fish that were 11 months of age were used as controls and are shown in the first row of each panel. Scale bars: 50 μm. (C) Western blot analysis for the activation of erk and akt in the livers of transgenic fish at different stages of HCC development. After measuring the band intensity using the UVP VisionWorks LS software, the relative density was normalized to β–actin. Ratios of p-erk/erk and p-akt/akt were analyzed, and the data are expressed as relative fold changes for src or src(p53-) transgenic fish relative to GFP-mC controls.