
- Title
-
Oesophageal and sternohyal muscle fibres are novel Pax3-dependent migratory somite derivatives essential for ingestion
- Authors
- Minchin, J.E., Williams, V.C., Hinits, Y., Low, S., Tandon, P., Fan, C.M., Rawls, J.F., and Hughes, S.M.
- Source
- Full text @ Development
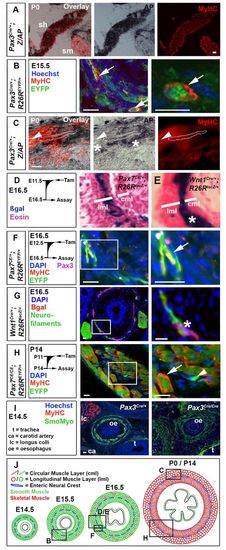
Pax3- and Pax7-expressing cells contribute to mouse OSM. (A-I) Immunodetection of MyHC (A-C,F,H,I), smooth muscle myosin (I), EYFP (B,F,H) and βgal (G); nuclei staining (DAPI/Hoechst; B,F-I); and histochemistry for alkaline phosphatase (AP; A,C) or βgal (D,E) on transverse cryosections of murine oesophagus. (A) The sternohyoid muscle (sh) was AP+, whereas the adjacent sternomastoid muscle (sm) was unlabelled. (B) Pax3Cre/+;R26REYFP mice show MyHC in some EYFP+ cells (arrows) at E15.5. (C) By P0, Pax3Cre/+;Z/AP mice have OSM cells marked with AP (dots outline an area of staining over a fibre). Some OSM is unmarked (arrowheads), and neural cells between the longitudinal and circumferential OSM layers are marked (asterisks). (D) Tamoxifen treatment of Pax7CE/+;R26RlacZ mice at E11.5 marked cells at E16.5 in outer longitudinal muscle layer (lml, where OSM is present) but only rare cells in inner circumferential muscle layer [cml, lacking OSM at this stage (see A)]. (E) Wnt1Cre;R26RlacZ (right panel) mice had neural crest cells between the muscle layers (asterisk). (F) Tamoxifen treatment of Pax7CE/+;R26REYFP mice at E12.5 marked OSM cells in lml at E16.5 with EYFP (arrow). Small rare Pax3+ cells are found adjacent to the OSM. (G) At E16.5, Wnt1Cre;R26RlacZ mice have βgal in a thin layer of neurofilament-containing cells between the muscle layers (asterisk). (H) Treatment of Pax7CE/CE;R26REYFP mice with tamoxifen at P11 led to abundant EYFP-marked OSM cells at P14 (arrow) and smaller EYFP-marked cells lacking MyHC (arrowhead). (I) At E14.5, Pax3Cre/Cre mice show slightly reduced and disorganised smooth muscle myosin (green), compared with Pax3Cre/+ littermates. There is a lack of longus colli striated muscle (lc) in mutant. ca, carotid artery; t, trachea; oe, oesophagus. (J) Mouse OSM development (red, sarcomeric myosin) among smooth muscle (green, smooth myosin), drawn approximately to scale. Boxed areas in the left panels are magnified on the right. Boxed areas in J are shown in panels above. Scale bars: 50 μm in A; 20 μm in B-I. |
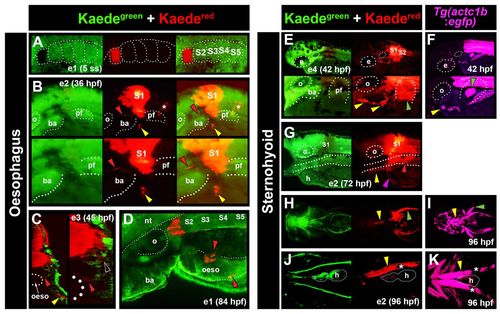
Lineage tracing of anterior somites in zebrafish marks OSM and SHM. Fluorescent images of primary green and photoconverted red Kaede (A-E,G,H,J). Images are from multiple embryos (e), photoconverted at either 3-5 ss (e1; A,D) or between 14 and 18 ss (e2-4; B,C,E,G,H,J). Tg(actc1b:egfp) labels muscle precursors (F,I,K). (A) Dorsal view confocal image showing photoconversion to Kaedered in S1 of e1 at 5 ss. (B) At 36 hpf, lateral view of e2 detected Kaedered in S1, and both anteriorly and medially migrating cells (yellow and red arrowheads, respectively). Marked cells were also observed associated with notochord (asterisks), and in neural tube as a result of photoconversion in overlying neural plate. (C) Cross-section confocal view of e3 at 45 hpf revealed medial cells localised to the oesophagus (oeso; red arrowheads; region magnified on right) and Kaedered in close proximity to the somite (black arrowhead). Anterior cells had intense label, reminiscent of SHM (yellow arrowhead). (D) e1 at 84 hpf. Dorso-lateral view confocal images showed Kaedered cells in close association with oesophagus. (E,F) Lateral view of e4 after photoconversion of S1+2 showing anteriorly located Kaedered (E, yellow arrowheads) in similar position to SHM primordium in Tg(actc1b:egfp) embryos (F, yellow arrowhead). (G) Lateral view of e2 reveals Kaedered in association with oesophagus (red arrowhead), SHM (yellow arrowhead) and common cardinal vein (magenta arrowhead) at 72 hpf. (H-K) Ventral confocal (J,K) and stereomicroscopic (H,I) views of e2 at 96 hpf showing Kaedered in left SHM (yellow arrowheads) and pectoral fin (green arrowheads), confirmed by Tg(actc1b:egfp). Melanophore pigment is located above SHM (J,K, asterisks). ba, branchial arches; e, eye; h, heart; nt, neural tube; oeso, oesophagus; o, otic vesicle; pf, pectoral fin. |
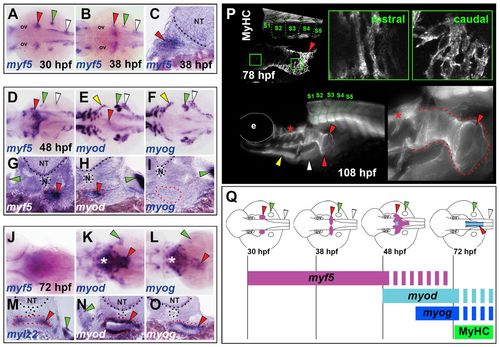
Developmental dynamics of OSM development in zebrafish. In situ hybridisation for myf5 (A-D,G,J), myod (E,H,K,N), myog (F,I,L,O) and mylz2 (M), or MyHC immunodetection (P). Images are either dorsal view wholemounts with anterior towards the left (A,B,D,F,H,J,K,M), transverse cryosections with dorsal towards the top (C,E,G,I,L,N,O) or lateral view wholemounts with anterior towards left and dorsal towards the top (P). (A-C) At 30-38 hpf, myf5 is expressed in somites (white arrowheads), pectoral fin (green arrowheads) and bilateral patches anterior to the pectoral fins (red arrowheads). (D-I) By 48 hpf, myf5 expression had coalesced at the midline, forming a distinctive chevron structure (red arrowheads) that had begun expression of myod but not myog, and was associated with oesophageal tissue (red dots). The anterior hypaxial muscle anlagen expressed both myod and myog (yellow arrowheads). (J-O) At 72 hpf, expression in OSM region of myf5 was greatly reduced, myod increased and myog appeared strongly. Asterisks indicate hypobranchial muscle in pharynx. At 72 hpf, weak oesophageal mylz2 expression commenced (red arrowhead). (P) MyHC was detected in OSM (red arrowheads) at 78 hpf and extended posteriorly to somite 4 (green dotted lines). By 108 hpf, OSM (red dotted lines) had a distinctive funnel shape still extending from above SHM (yellow arrowhead) and PHM (white arrowhead) only to somite 4. Asterisks indicate hypobranchial muscles in pharynx. (Q) OSM morphogenesis and temporal onset of MRF gene expression from a dorsal view. Arrowheads indicate OSM (red), SHM (yellow), pectoral fin muscle (green) and PHM (white). e, eye; N, notochord; NT, neural tube; ov, otic vesicle. |
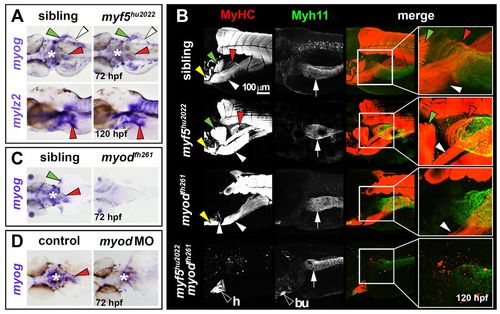
OSM is Myod dependent in zebrafish. In situ hybridisation for myog (A,C,D) or mylz2 (A), and immunodetection of MyHC (B) and Myh11 (B). Dorsal view wholemounts are oriented anterior towards the left (A, upper panels; C,D). Lateral view wholemounts are oriented anterior towards the left and dorsal towards the top (A, lower panels; B). (A) At 72 hpf, myog mRNA expression was indistinguishable from that in wild-type siblings in OSM of myf5hu2022 mutants (red arrowheads). PHM, PFM and pharynx muscle were also unchanged (white arrowheads, green arrowheads and asterisk, respectively). Myosin mRNA (mylz2) at 120 hpf was unaltered in myf5hu2022 mutants, suggesting OSM terminal differentiation occurs normally after reduction of Myf5 (red arrowheads). (B) OSM and smooth muscle differentiation was unaffected in myf5hu2022 mutants (red arrowheads and white arrows, respectively). In myodfh261 mutants, MyHC within OSM was absent, but SHM and PHM differentiated well (yellow and white arrowheads, respectively), as did oesophageal smooth muscle (white arrows). Double myf5hu2022;myodfh261 mutants had no striated skeletal muscle, but cardiac striated muscle (h) was readily observed, as was smooth muscle in the gastrointestinal tract and bulbus arteriosus (bu). (C,D) myog mRNA reduction in the oesophageal region of myodfh261 mutants (C) and myod morphants (D). Asterisk indicates pharyngeal muscle. Arrowheads indicate OSM (red), SHM (yellow), pectoral fin muscle (green) and PHM (white). White arrow indicates oesophageal smooth muscle. EXPRESSION / LABELING:
PHENOTYPE:
|
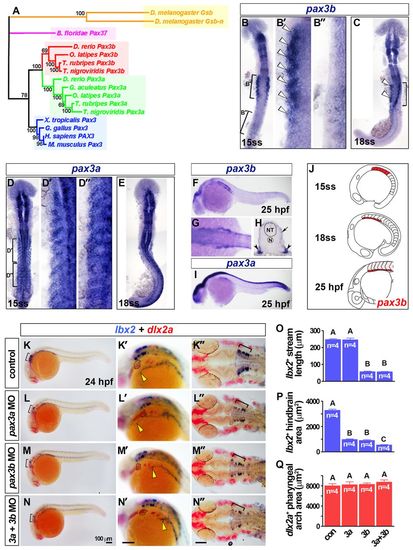
Somitic pax3b is localised to the ventrolateral somite and required for MMP migration. (A) Phylogeny of Pax3 proteins using the Bayesian Monte Carlo Markov chain method with 10,000 bootstrap replicates (MrBayes v3.1.2) (Ronquist and Huelsenbeck, 2003). Tetrapod Pax3 genes are blue; teleost Pax3a and Pax3b clades are green and red, respectively; a cephalochordate Pax3/7 homolog is magenta; and orange indicates insect homologs. (B-N) In situ hybridisation for pax3b (B,C,F-H), pax3a (D,E,I), lbx2 and dlx2a (K-N′). Dorsal view flatmounts have anterior towards the top (B-E) or anterior towards the left (K′-N′). Lateral view wholemounts have anterior towards the left and dorsal towards the top (F,I,K-N′), dorsal view, wholemount has anterior towards the left (G). Transverse cryosection has dorsal towards the top (H). (B,C) Somitic pax3b mRNA was restricted to the anterior somites at 15 and 18 ss (white arrowheads). (D,E) Somitic pax3a was expressed in all somites at 15 and 18 ss. (F-I) At 25 hpf, somitic pax3b was localised to the ventrolateral region of anterior somites (arrowheads, H) and dermomyotome (arrow, H), as was pax3a (I). (J) Somitic pax3b expression dynamics (pink indicates dermomyotome at 25 hpf). (K-N′) Rostral extension of lbx2+ cells (yellow arrowheads) had reached the hyoid arch (dotted outline) at 24 hpf in controls, but was severely reduced in pax3b morphants and pax3a+pax3b double morphants. Scale bars: 100 μm. (O-Q) Rostral migration of lbx2+ cells at 24 hpf was significantly reduced (O; group A versus B; P<0.0001) as was the area of hindbrain lbx2+ expression (brackets in K-N and K′-N′) (P; P<0.0001; groups A-C differ significantly P<0.05). By contrast, the area of dlx2a expression in pharyngeal arches was unaltered after pax3 manipulation (Q; P=0.7282). Data are mean+s.e.m. EXPRESSION / LABELING:
PHENOTYPE:
|
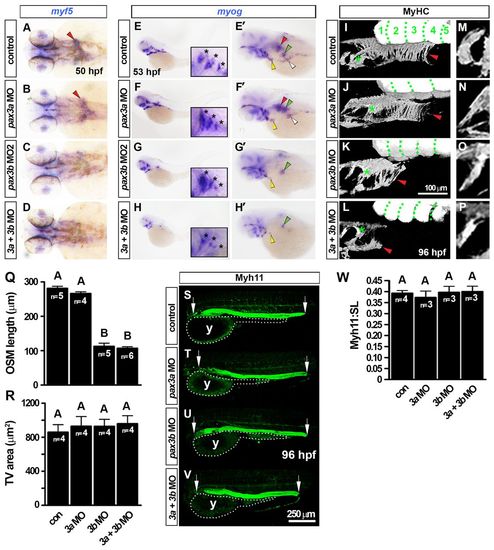
pax3b morphants have reduced OSM but unaffected development of gastrointestinal smooth muscle. In situ hybridisation for myf5 (A-D) and myog (E-H′) and immunodetection of MyHC (I-P) and Myh11 (S-V). Wholemounts have anterior towards the left in dorsal (A-D), lateral (E-H, I-P,S-V; dorsal to top) or dorsal oblique views (E′-H′). (A-D) Loss of myf5 mRNA from the ‘inverse fountain’ OSM region in pax3b morphants (red arrowheads). (E-H′) Reduction in myog mRNA in pax3b morphant OSM (red arrowheads), SHM (yellow arrowheads), PHM (white arrowheads) and PFM (green arrowheads). In pax3a morphants, myog expression in all muscles was indistinguishable from controls. Insets and asterisks show comparable opercular muscle developmental in pax3b morphants and controls. (I-L) At 96 hpf, MyHC had accumulated in control and pax3a morphant OSM (red arrowheads), extending caudally to somite 3-4. Green dots delineate somites. pax3b and pax3b+pax3a morphants had severely reduced OSM (red arrowheads). (M-Q) Shape, orientation and area of tranversus ventralis (TV) muscles were unaffected after pax3 manipulation. (R) OSM length was measured from the caudal-most hypobranchial muscle in the pharynx (asterisks in I-L) to the caudal edge of OSM (red arrowheads in I-L). A and B groups differ significantly (P<0.0001). (S-V) Myh11 was unchanged after pax3 manipulation. Arrows indicate anterior and posterior extent for Myh11 length measurements. (W) Fraction of larvae standard length (SL) occupied by Myh11+ was not altered after pax3 manipulation. y, yolk. Data are mean+s.e.m. |
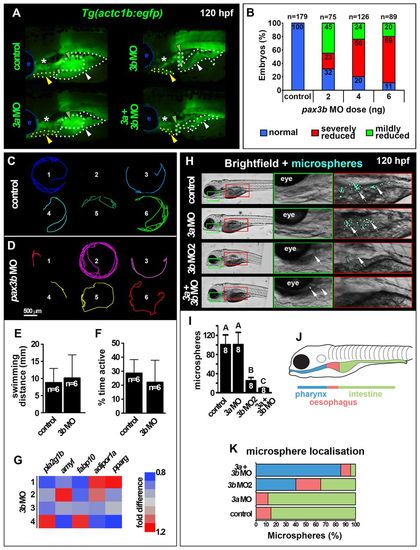
pax3b morphants are metabolically normal but exhibit reduced swallowing capability. All images are lateral view wholemounts with anterior towards the left and dorsal towards the top. (A) Somite-derived hypaxial muscles of 120 hpf Tg(actc1b:egfp) larvae showing PFM (green dots and arrowheads), PHM (white dots and arrowheads) and SHM (yellow dots and arrowheads) muscle reduction and disorganization in pax3b and double morphants. e, eye; asterisk, cranial muscles. (B) Dose dependence of Tg(actc1b:egfp) hypaxial muscle defect in pax3b morphants. (C,D) Migration tracks over 5 minutes of six control (C) and pax3b MO 120 hpf larvae (D). (E,F) Distance swum (E, P=0.87) and time active (F, P=0.73) in a 5-minute period were not significantly different between control and pax3b morphants (unpaired t-tests). Data are mean+s.e.m. (G) qRT-PCR of metabolic marker mRNAs showed no significant difference (pairwise t-tests) between control and pax3b morphants at 120 hpf. Values from four biological replicates (rows 1-4, 10 larvae/sample normalized to 18S rRNA). (H) Fluorescent microspheres fed to 120 hpf larvae were swallowed and detected in the GI tract (arrows). (I) Number of swallowed microspheres in controls and pax morphants. Groups A, B and C differ significantly (P<0.0001). Data are mean+s.e.m. (J,K) Colour-coded regions of GI tract (J) in which microspheres were distributed in control and morphants (K). |
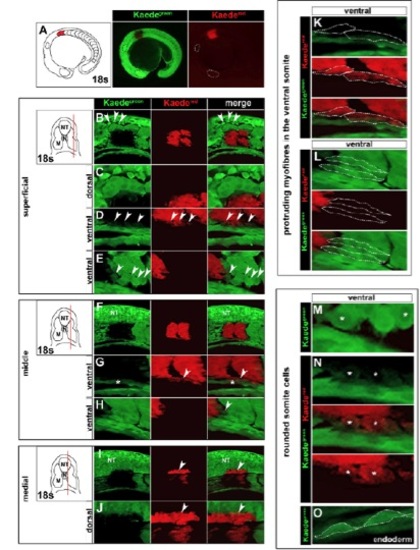
Precision of Kaede photoconversion within the anterior somites of zebrafish. Primary green Kaede (Kaedegreen) fluorescence and photoconverted red Kaede (Kaedered) fluorescence. All images are whole-mount lateral views of a single embryo taken immediately after photoconversion, with anterior towards the left and dorsal towards the top. (A) Stereomicroscopic view of S1+2 photoconversion at 18 ss. (B) Superficial section through a ventral region photoconversion of S1+2 at 18 ss to avoid neural crest cells in the migratory zone (arrowheads). (C) Higher magnification view of unconverted neural crest cells. (D,E) Mesenchymal Kaedered cells in ventral somite regions (D, arrowheads) share similar morphology to Kaedegreen somite cells (E, arrowheads). These cells are shown at higher magnification in M,N. (F) Middle section through a ventral region photoconversion of S1+2 at 18 ss. (G,H) Kaedered cells in ventral somite regions (G, arrowheads) are distinct from endoderm (G, asterisk) and share identical morphology to Kaedegreen myofibres that protrude anteriorly from the ventral somite (H, arrowhead). These cells are shown at higher magnification in K,L. (I,J) Medial section through a ventral region photoconversion of S1+2 at 18 ss reveals neural tube (NT) photoconversion (arrowheads). (K,L) High magnification of Kaedered or Kaedegreen myofibres that protrude from the ventral somite (dotted lines). (M,N) Mesenchymal Kaedegreen or Kaedered ventral somite cells have similar rounded morphology distinct from fibres that includes large intracellular zones of low Kaede fluorescence (asterisks). (O) These ‘rounded’ somite cells are distinct from endoderm cells, which are tightly connected and have a distinctive ‘flattened’ morphology (dotted lines). |
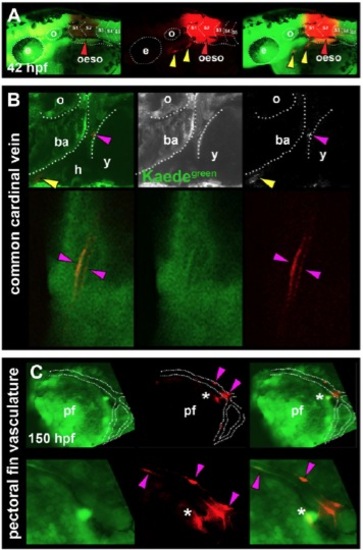
Cells associated with the heart and pectoral fin vasculature are derived from anterior somites in zebrafish. Primary green Kaede (Kaedegreen) fluorescence and photoconverted red Kaede (Kaedered) fluorescence. All images are lateral view wholemounts with anterior towards the left and dorsal towards the top. (A) Kaedered fluorescence localised to the oesophagus after photoconversion at 18 ss (red arrowheads). SHM was also labelled with Kaedered (yellow arrowheads). (B) Photoconversion of S2 at 14-18 ss marks vascular elements associated with the common cardinal vein (magenta arrowheads) and SHM (yellow arrowheads). (C) In addition, cells associated with pectoral fin vasculature and other unidentified cells were labelled after photoconversion of S1/2 (magenta arrowheads and asterisks, respectively). Labelled blood vessels were observed only in tissues adjacent to the original somites converted, suggesting regional restriction of somite-derived vasculature. ba, branchial arches; oeso, oesophagus; h, heart; pf, pectoral fin; o, otic vesicle; y, yolk. |
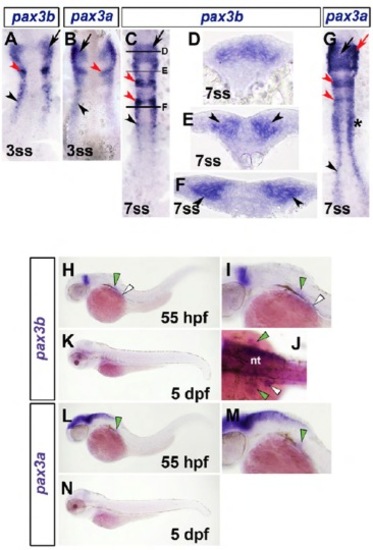
Expression analysis of zebrafish pax3a and pax3b. In situ mRNA hybridization for pax3b (A,C-F,H-K) and pax3a (B,G,L-N). Dorsal flatmounts have anterior towards the top (A-C,G). Transverse cryosections have dorsal towards top (D-F). Lateral view wholemounts have anterior to left and dorsal to top (H,I,K-N). Dorsal wholemounts have anterior to left (J). (A,B) pax3b and pax3a mRNA at 3 ss were located in neural tissue in cranial regions (black arrow), including prospective rhombomere 2 (red arrowhead) and bilateral stripes corresponding to lateral neural plate (black arrowhead). (C-F) At 7 ss, pax3b continued to be expressed in cranial neural tissue (black arrow), including rhombomeres 2 and 4 (red arrowheads) and bilateral stripes in posterior of embryo (black arrowhead). Black bars in C denote level of section in D-F pax3b mRNA was located in dorsal region of neural tube within more developed neural tissue (D). Posteriorly, in less developed neural tissue (E), pax3b was located at lateral margin of neural plate (black arrowheads, F). (G) pax3a mRNA was also detected in lateral neural plate at 7 ss (black arrowhead), in addition to somites (asterisk), cranial neural crest (black arrow) and rhombomeres 2 and 4 (red arrowheads). (H-K) At subsequent embryonic (HJ, 55 hpf) but not larval (K, 5 dpf) stages, pax3b mRNA was detected weakly in pectoral fin (green arrowheads) and more readily in MMPs located close to the somite (white arrowheads). (L-N) pax3a mRNA was detected in pectoral fin muscle of late embryo (green arrowheads, L,M), but not larva (N). nt, neural tube. |
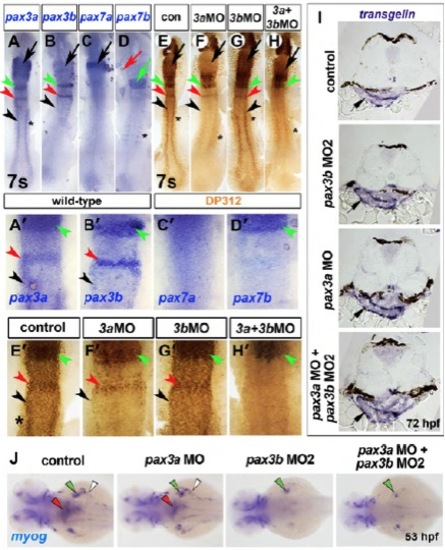
pax3b morpholinos specifically reduce Pax3b protein but not transgelin expression. In situ mRNA hybridization for pax3a (A,A′), pax3b (B,B′), pax7a (C,C′), pax7b (D,D′), transgelin (I), myog (J) and parallel immunodetection of nuclear Pax3/7 protein (brown, DP312 antibody, E-H′) in 7 ss embryos injected with the indicated MOs. Dorsal view flatmounts with anterior towards the top (A-H′) or left (J). Transverse cryosections with dorsal towards the top (I). (A-B′) pax3a was detected in rhombomeres 2 (green arrowheads, A,A′) and 4 (red arrowheads, A,A′), lateral neural plate (black arrowheads, A,A′) and somites (asterisk, A,A′). Concurrently, pax3b mRNA was also observed in rhombomere 2 (green arrowhead, B,B′), rhombomere 4 (red arrowhead, B,B′) and lateral neural plate (black arrowhead, B,B′) but was lacking in somites (B,B′). (C-D′) The related pax3/7 family member pax7a was expressed solely in the midbrain region (black arrow, C), whereas pax7b mRNA was detected in somites (asterisk, D) and a broad anterior hindbrain region (green arrow and arrowhead, D,D2). Therefore, of pax3/7 family members, pax3a was the most widely and abundantly expressed at 7 ss, encompassing expression domains of all other pax3/7 family members. (E,E′) Pax3/7 immunoreactivity closely resembles the sum of all pax3/7 mRNA localisation, with the addition of signal in the forming retina owing to the known reaction of DP312 with Rx proteins (asterisks, E) (Davis et al. 2005). (F-G′) Injection of MO1 specific to pax3b did not result in a detectable reduction of Pax3/7 protein (G,G′), in agreement with residual reactivity to other Pax3/7 proteins, particularly Pax3a. After MO1-mediated Pax3a reduction (F,F′), Pax3/7 protein is clearly evident in regions of pax3b expression including rhombomere 2 (F,F′, green arrowheads), rhombomere 4 (F,F′, red arrowheads) and lateral neural plate (F,F′, black arrowheads), suggesting that residual Pax3/7 reactivity represents Pax3b. Using two non-overlapping pax3a MOs, we failed to observe the head phenotype previously described for pax3a knockdown (Lin et al. 2009). (H,H′) Knockdown of both Pax3b and Pax3a proteins resulted in the ablation of the residual Pax3/7 immunoreactivity in rhombomere 4 and lateral neural plate, which corresponded to Pax3b. Remaining Pax3/7 protein anteriorly is likely to reflect Pax7b protein (green arrowhead, H′) (Davis et al. 2005; Minchin and Hughes 2008). Therefore, we conclude that residual immunoreactivity after Pax3a reduction corresponds in part to Pax3b protein and that this is specifically reduced by pax3b MO1, which does not itself target Pax3a. Similar results were obtained with pax3a MO2 and pax3b MO2 (Table S1). (I) transgelin mRNA in oesophagus at 72 hpf did not change after pax3 manipulation (arrows). (J) myog mRNA in oesophagus (red arrowheads), pectoral fin muscle (green arrowheads) and posterior hypaxial muscles (white arrowheads) is reduced in pax3b and pax3a+pax3b double morphants. |
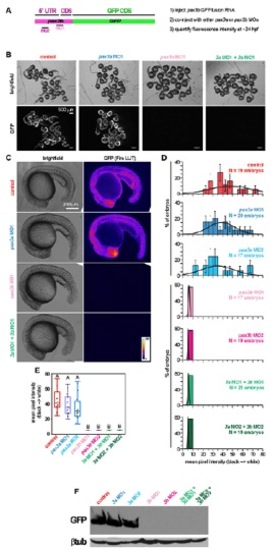
pax3b, but not pax3a, MOs efficiently reduce translation of chimeric 5′UTRpax3b:GFP RNA. (A) Primers (forward with XhoI site 5′-gcgctcgagtgatcgtggaatattacatg-3; reverse with BamHI site 5′-gcgggatcc gagagtgatgggcgcatcat-3′) were used to amplify 62 bp of pax3b 5′UTR and 48 bp of pax3b-coding sequence. The resulting fragment was cloned in frame with EGFP in pEGFP-N1 (Invitrogen) to produce a 5′UTRpax3b:eGFP fusion protein. 5′UTRpax3b:eGFP was then subcloned into pSP64T, and RNA was transcribed using SP6 (Ambion). RNA (250 pg) was injected alone, or together with MO, into one-cell stage embryos. (B) At 24 hpf, embryos of control (5′UTRpax3b:eGFP) and 5′UTRpax3b:eGFP plus pax3a MO1 or MO2 contained high levels of GFP fluorescence. Embryos with either pax3b MO had no detectable fluorescence, indicating complete inhibition of 5′UTRpax3b:eGFP translation by pax3b MOs. (C) Images of single embryos were taken at identical magnifications and exposure. Background was normalized using the ‘Subtract Background’ feature of ImageJ (1.47n5). Pixel intensity of 8-bit greyscale images was visualized using the ‘Fire’ LUT. (D) Mean pixel intensity per embryo was normally distributed. (E) The mean pixel intensities were significantly reduced after addition of pax3b MO, as determined by ANOVA and Tukey’s post hoc test. (F) Protein lysates were separated by 12% SDS-PAGE and probed using antibodies against GFP or β-tubulin (loading control). |
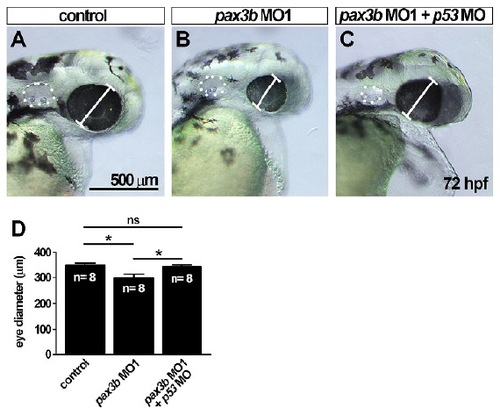
pax3b MO1 induces a small eye phenotype that is rescued by co-injection of p53 morpholino. (A-C) Bright-field images of eye in control (A), pax3b MO1-injected (B) and pax3b MO1- and p53 MO-injected (C) larvae at 72 hpf. (D) Quantification of eye diameter reveals injection of pax3b MO1 leads to a smaller eye (P<0.05), that is rescued by co-injection of a p53 MO (*P<0.05). Oneway ANOVA followed by a Tukey’s post hoc test. |
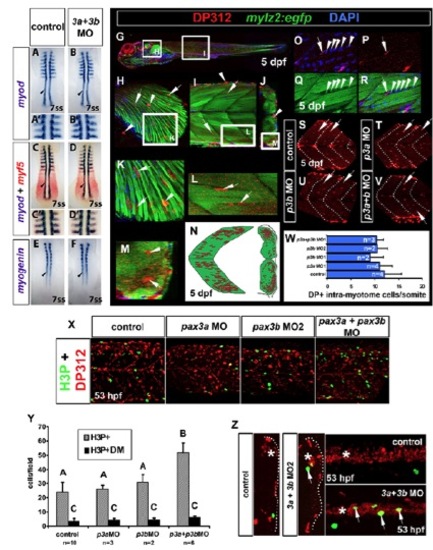
Early myogenesis and Pax3/7+ intra-myotome cells occur normally in pax3b morphants. In situ hybridisation of myod (A-B&prime& blue, C-D′), myf5 (red, C-D′) and myogenin (E,F). Immunodetection of DP312 (G-M,O-V; red, X,Z) and phospho-histone H3 (H3P) (green, X,Z) in wild-type (A-F,X,Z) and Tg(mylz2:egfp) backgrounds. (A-F) Expression of myod, myf5 and myog at 7 ss are unaffected in pax3a+pax3b double morphants. (G-M) DP312+ intra-myotome cells (IMCs) localise to inter-fibre regions, reminiscent of Pax7+ myogenic cells (Seger et al., 2011). (N) IMC location. (O-R) IMCs are likely to be myogenic as they are observed closely juxtaposed to myogenic nuclei (Q,R, arrowheads) during myotube fusion (R). (S-W) Number of IMCs at 5 dpf is unchanged in pax3a, pax3b and pax3a+pax3b double morphants. (X,Y) Cell proliferation of dermomyotome cells (DM), as assessed by faint DP312/H3P+ nuclei (green, X) is unchanged after pax3 manipulation (Y). However, total H3P+ nuclei are significantly increased in pax3a+pax3b double morphants (Y) (P<0.0001). (Z) Increase in H3P+ nuclei occurs in the neural tube. Asterisks indicate neural tube. Arrows indicate H3P+ nuclei within neural tube. One-way ANOVA and Tukey’s post hoc test. |
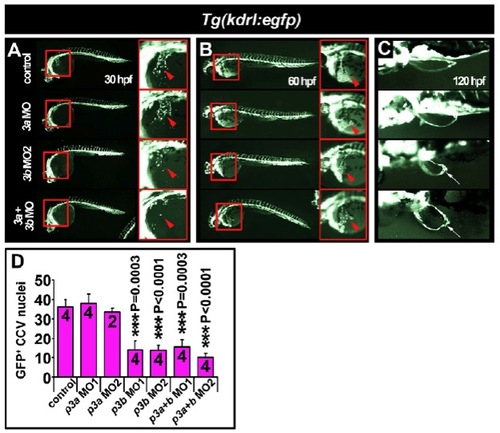
Common cardinal vein development is delayed at 30 hpf in pax3b morphants. Fluorescent images of live embryos expressing eGFP under the kdrl (formerly known as flk1 or vegfr2) promoter (A-C). Whole-mount lateral (A,B) or dorsal (C) views, anterior towards the left. (A) In 30 hpf embryos, general vasculogenesis was unimpaired after pax3a/b knockdown. However, the forming common cardinal vein (CCV) was reduced in pax3b single and double pax3a/b morphants (arrowheads). Boxed areas indicate regions magnified in the corresponding panels on the right. (B) In 60 hpf larvae, the general integrity of the vascular system was indistinguishable between control and pax3a/b morphants. Endothelial cells of the CCV had spread across the yolk (arrowheads). (C) Pectoral fin vasculature developed normally in pax3a, pax3b and pax3a+pax3b double morphants. The pectoral fin is malformed after pax3b manipulation (arrows). (D) Quantification of eGFP+ CCV nuclei at 30 hpf, mean±s.e.m. Sample number is indicated within each bar. |
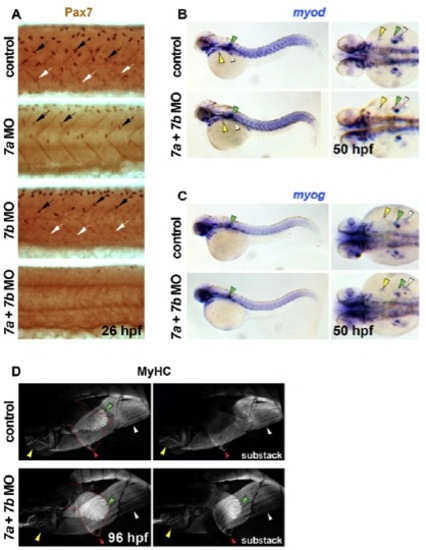
Pax7 proteins are not required for MRF gene expression and subsequent hypaxial and oesophageal striated muscle formation. Immunodetection of Pax7 (A) and sarcomeric MyHC (D) or in situ mRNA hybridization for myod (B) and myog (C). Lateral view wholemounts have anterior towards the left and dorsal towards the top (A-C, left panels; D). Dorsal view wholemounts have anterior towards the left (B and C, right panels). (A) Nuclear Pax7 proteins accumulate weakly in dermomyotome cells (white arrows) and strongly in xanthophores (black arrows) overlying the somites at 26 hpf. Whereas pax7a MO diminishes dermomyotomal Pax7, both pax7a and pax7b MOs are required to remove all immunodetection. (B,C) Injection of dual pax7a+pax7b MOs has no discernible effect upon either myod (B) or myog (C) mRNA accumulation in anterior or posterior hypaxial muscle anlage or pectoral fin at 50 hpf (yellow, white and green arrowheads, respectively). (D) At 96 hpf, sarcomeric MyHC had accumulated in OSM (red markers) and extended caudally in both control and pax7a+pax7b morphant animals. |
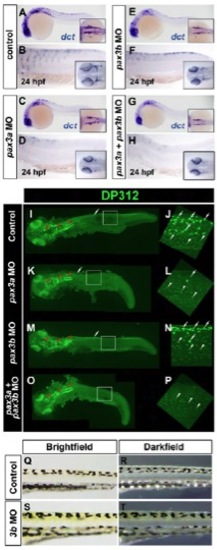
Markers of neural crest are still expressed in pax3b morphants. In situ mRNA hybridisation of dct (A-H) and immunodetection of DP312 (I-O). Lateral view wholemounts are oriented anterior towards the left and dorsal towards the top (A-P); insets in A,C,E,G are wholemount dorsal views with anterior towards the left. Insets in B,D,F,H are dorsal views with anterior towards the left. (A-H) dct expression in melanoblasts is reduced in pax3a single and pax3a+pax3b double morphants (Minchin and Hughes, 2008), but pax3b morphants are similar to controls. (I-P) Intensely labelled DP312+ cells corresponding to xanthophores are still present in pax3b morphants (L). (Q-T) At 5 dpf, pigmentation is grossly normal in pax3b morphants. |