
- Title
-
Long-Range Ca(2+) Waves Transmit Brain-Damage Signals to Microglia
- Authors
- Sieger, D., Moritz, C., Ziegenhals, T., Prykhozhij, S., and Peri, F.
- Source
- Full text @ Dev. Cell
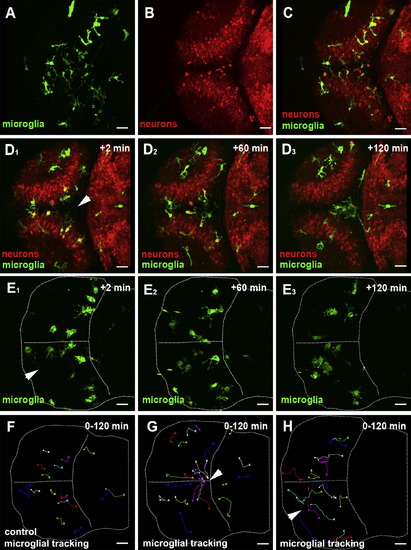
Microglial Migration upon Laser-Induced Neuronal Injuries(A) Dorsal view of a 3 dpf larval brain. Microglia (pU1::Gal4-UAS-GFP).(B) Dorsal view of a 3 dpf larval brain. Neurons (NBT::DsRed).(C) Overlay of (A) and (B).(D1–D3) Confocal time-lapse showing microglia (green) responding to a central injury (recording times indicated) (Movie S1, left). The injury site is marked with a white arrowhead.(E1–E3) Confocal time-lapse showing microglia (green) responding to a single-hemisphere injury (recording times indicated) (Movie S1, right). The injury site is marked with a white arrowhead.(F) Microglial cell tracking over 120 min in the preinjured brain. The starting point of individual tracks is marked with an X and the end point with a dot.(G) Microglial cell tracking over 120 min upon central injury. The injury site is marked with a white arrowhead.(H) Microglial cell tracking over 120 min upon single-hemisphere injury. The injury site is marked with a white arrowhead.Scale bars for all images: 20 μm. All images were produced using an Olympus FV 1000 with a 40×/NA 1.15 objective.See also Figure S1and Movie S1. EXPRESSION / LABELING:
|
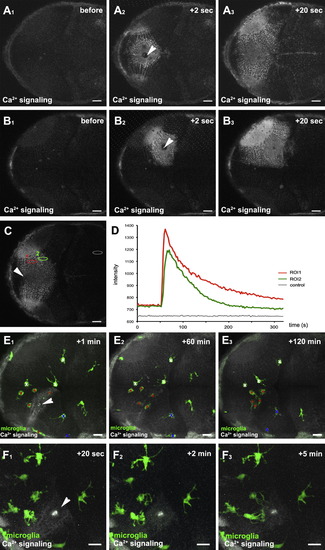
Neuronal Injuries Initiate Long-Range Ca2+ Transients in the Brain(A1–A3) Dorsal views of a 3 dpf larval brain showing the time course of a Ca2+ wave (beta-actin::GCaMP3.1) forming upon central brain injury (Movie S2). The injury site is marked with a white arrowhead.(B1–B3) Time course of a Ca2+ wave (beta-actin::GCaMP3.1) forming upon single-hemisphere injury (Movie S2, upper right). The injury site is marked with a white arrowhead.(C) Ca2+ wave (beta-actin::GCaMP3.1) upon central brain injury with regions of interest (ROI1, ROI2, and control) for intensity measurements marked with red, green, and gray ellipses, respectively. The injury site is marked with a white arrowhead.(D) Intensity plot of the Ca2+ signal over time measured in ROI1, ROI2, and control shown in (C).(E1–E3) Time course of Ca2+-wave (beta-actin::GCaMP3.1) and microglial movement (pU1::Gal4-UAS-TagRFP) upon killing of around 10 neurons (Movie S2, lower left). The injury site is marked with a white arrowhead. Microglial cells responding to the injury are marked with red asterisks, while microglia in the same hemisphere not responding to injury are labeled with blue Xs. Microglia in the other hemisphere are labeled with a white X.(F1–F3) Time course of Ca2+ wave (beta-actin::GCaMP3.1) and microglial branching (pU1::Gal4-UAS-TagRFP) upon killing of around 10 neurons (Movie S2, lower right). The injury site is marked with a white arrowhead. Scale bars for all images: 20 μm. All images were produced using an Olympus FV 1000 with a 40X/NA1.15 objective.See also Movie S2. EXPRESSION / LABELING:
|
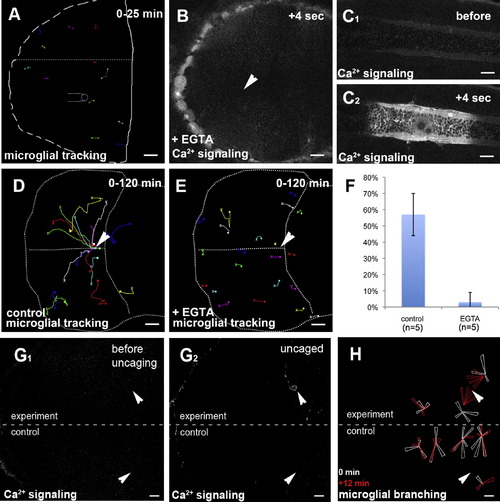
Ca2+ Signaling Prefigures and Guides Microglial Migration(A) Microglial tracking (pU1::Gal4-UAS-TagRFP) upon control injection of water in a 3 dpf larval brain. The starting point of individual tracks is marked with an X and the end point with a dot.(B) Injection of EGTA blocks the formation of Ca2+ waves (beta-actin::GCAMP3.1) upon laser injury (Movie S3, middle). The site of injury is marked with a white arrowhead.(C1 and C2) Control injury in the trunk of the same embryo as in (B). Ca2+ imaging (beta-actin::GCAMP3.1) before (C1) and after (C2) injury (Movie S3, right).(D) Cell tracking of microglia (pU1::Gal4-UAS-TagRFP) upon central brain injury in a control embryo. The white arrowhead marks the site of injury. The starting point of individual tracks is marked with an X and the end point with a dot.(E) Cell tracking of microglia (pU1::Gal4-UAS-TagRFP) upon central brain injury in a EGTA injected embryo. The site of injury is marked with a white arrowhead. The starting point of individual tracks is marked with an X and the end point with a dot.(F) Quantification of microglia movement to an injury site (percentage of microglia in the optic tectum responding to injury) in control (left, n = 5) and EGTA-injected brains (right, n = 5). Error bars represent standard deviations.(G) Single-hemisphere injections of caged IP3 (experiment). Single-neuron uncaging leads to Ca2+ signaling (beta-actin::GCaMP3.1) in the injected, but not in the control, side. Laser uncaging sites before (G1) and after (G2) uncaging are marked by white arrowheads.(H) Rose plot of microglial response to IP3 uncaging, showing microglia positions before (white) and 12 min after (red) uncaging.Scale bars for all images: 20 μm. Images in (B)–(F) were produced using an Olympus FV 1000 with a 40×/NA1.15 objective. Images in (A) and (G)–(H) were done using an Andor Spinning Disk Confocal with a 20×/NA0.7 objective.See also Figure S1 and Movies S3, S4, and S6. |
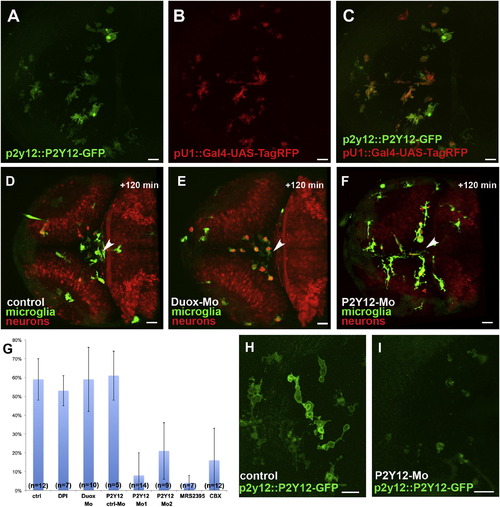
Microglial Movement Is Controlled via P2Y12 Activation(A) Microglial cells express a P2Y12-GFP fusion protein under the endogenous P2Y12 promoter (p2y12::P2Y12-GFP).(C) Overlay of (A) and (B).(D–F) microglia (pU1::Gal4-UAS-GFP) and neurons (NBT::DsRed) in wild-type (D), Duox-morpholino-injected (E), and P2Y12-morpholino-injected embryos (F) 120 min after central injury. The sites of injury are marked with white arrowheads.(G) Percentage of microglia in the optic tectum moving to the injury site in control (n = 12), DPI-treated (n = 7), Duox morphant (n = 10), MRS2395-treated (n = 7), CBX-treated (n = 12), P2Y12-Mo1-injected (n = 14), P2Y12 Mo2-injected (n = 9), and P2Y12 ctrl Mo-injected (n = 5) brains. Error bars represent standard deviations.(H and I) Dorsal views of a 3 dpf larval brain, showing microglia in the p2y12::P2Y12-GFP line (H) and how P2Y12-morpholino injection strongly decreases P2Y12-GFP expression in these microglia (I).Scale bars for all images: 20 μm. All images were produced using an Olympus FV 1000 with a 40×/NA1.15 objective.See also Figure S2 and Movies S4 and S5. |
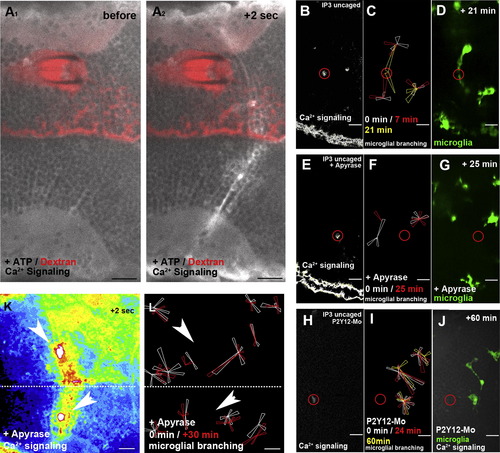
ATP Does Not Influence Ca2+ Wave Formation but Promotes Microglial Movement(A1) Injection of ATP does not promote Ca2+ wave formation (beta-actin::GCaMP3.1).(A2) Same ATP-injected embryo as in (A1) shows normal Ca2+ wave formation upon laser injury.(B) Ca2+ signaling (beta-actin::GCAMP3.1) after IP3 uncaging (Movie S6, left). The location of the uncaging is marked with a red circle.(C) Rose plot of microglial response to IP3 uncaging showing images before uncaging (white) and 7 min (red) and 21 min (yellow) after uncaging.(D) Microglial response (pU1::Gal4-UAS-TagRFP) in the same embryo as in (C) 21 min after IP3 uncaging (Movie S6, right).(E) Ca2+ signaling (beta-actin::GCAMP3.1) upon IP3 uncaging in an embryo additionally injected with apyrase (Movie S7, upper left).(F) Rose plot of microglial response to IP3 uncaging in an apyrase-injected brain showing images before (white) and 25 min after (red) uncaging.(G) Microglial response (pU1::Gal4-UAS-TagRFP) in the same embryo as in (F) 25 min after IP3 uncaging (Movie S7, upper right).(H) Ca2+ signaling (beta-actin::GCAMP3.1) upon IP3 uncaging in an embryo injected with P2Y12-Mo (Movie S7>, lower left).(I) Rose plot of microglial response to IP3 uncaging in a P2Y12-depleted brain showing microglia positions before (white) and 24 min (red) and 60 min (yellow) after uncaging.(J) Microglial response (pU1::Gal4-UAS-TagRFP) in the same embryo as in (I) 60 min after IP3 uncaging ( |
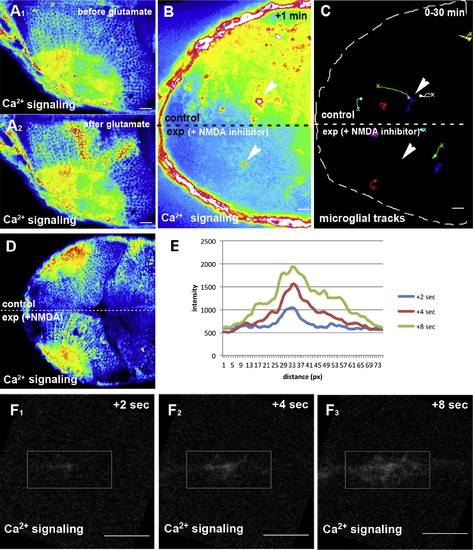
Glutamate Promotes Ca2+ Signaling and Microglial Movement(A) Ca2+ signaling (beta-actin::GCAMP3.1) before (A1) and after (A2) injection of glutamate.(B) Single-lobe injection (exp) of NMDA inhibitors blocks Ca2+-wave (beta-actin::GCAMP3.1) formation upon laser injury. Laser ablation sites are marked by white arrowheads.(C) Microglial tracking in the same NMDA-inhibitor-injected embryo as in (B). Laser ablation sites are marked by white arrowheads. The starting point of individual tracks is marked with an X and the end point with a dot.(D) Single-lobe injection (exp) of NMDA induces Ca2+-wave (beta-actin::GCAMP3.1) formation.(E) Intensity plot of the Ca2+ signal upon NMDA uncaging measured 2 s, 4 s, and 8 s after uncaging within the ROI shown in (F).(F) Ca2+ signaling (beta-actin::GCAMP3.1) 2 s (F1), 4 s (F2), and 8 s (F3) after uncaging of NMDA (Movie S11, upper left).Scale bars for all images: 20 μm. All images were produced using an Andor Spinning Disk Confocal with a 20×/NA0.7 objective.See also Movies S9, S10, and S11. |
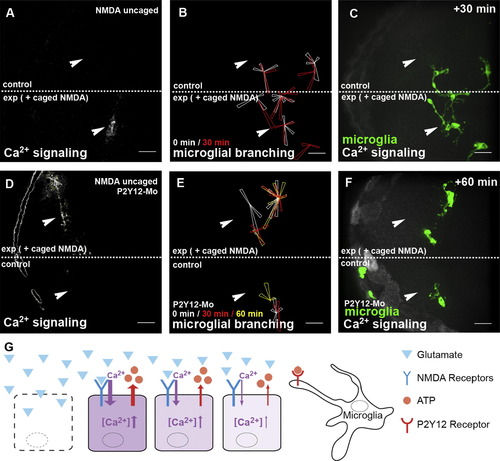
Microglial Branching toward Sites of Glutamate Signaling Is Mediated via the Microglial ATP Receptor P2Y12(A) Single-hemisphere injections of caged NMDA. Uncaging leads to Ca2+ signaling (beta-actin::GCaMP3.1) in the injected, but not in the control, side (Movie S11, upper). Laser uncaging sites are marked by white arrowheads.(B) Rose plot of microglial response to NMDA uncaging, showing microglia positions before (white) and 30 min after (red) uncaging.(C) Microglial response (pU1::Gal4-UAS-TagRFP) in the same embryo as in (B) 30 min after NMDA uncaging (Movie S11, upper).(D) Single-hemisphere injections of caged NMDA in P2Y12-Mo-injected embryos. Laser uncaging sites are marked by white arrowheads.(E) Rose plot of microglial response to NMDA uncaging in P2Y12-depleted brains showing microglia positions before (white) and 30 min (red) and 60 min (yellow) after uncaging.(F) Microglial response (pU1::Gal4-UAS-TagRFP) in the same embryo as in (E) 60 min after NMDA uncaging ( |
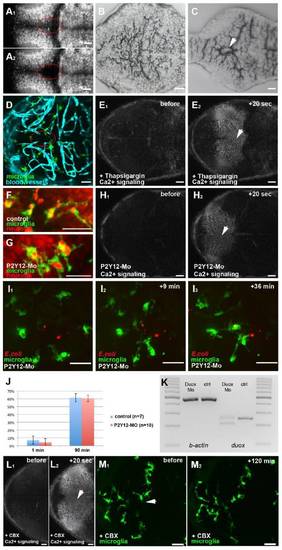
Neuronal injuries and the formation of Ca2+ waves, related to Figure 3 (A1 and A2) Dorsal views of a 3 dpf larval brain, showing neurons (NBT::DsRed) before (A1) and after (A2) injury. (B and C) Histological sections of an un-injured (B) and injured brain (C). The lesion is marked with a white arrowhead. (D) Dorsal view of a 3 dpf larval brain showing microglia in green (pU1::Gal4-UAS-TagRFP) and the vasculature in blue (Fli::eGFP). (E1 and E2) Time lapse of Ca2+ signaling (beta-actin::GCaMP3.1) in a Thapsigargin injected brain before (E1) and after (E2) laser ablation (white arrowhead). (F) Microglia (pU1::Gal4-UAS-GFP) engulf neurons (NBT::DsRed) as shown by the red neuronal material present within the cell. (G) P2Y12 morphant microglia engulf red neuronal material as control cells. (H1 and H2) Time lapse of Ca2+ signaling (beta-actin::GCaMP3.1) in a P2Y12-Mo injected embryo before (H1) and after (H2) laser ablation (white arrowhead). (I1-I3) Time lapse of the microglial response (pU1::Gal4-UAS-GFP) towards bacteria (E. coli) in a P2Y12-Mo injected embryo (Mov.S5). (J) Percentage of microglia in a 100 μm wide circle around the side of injection having engulfed bacteria in control and P2Y12 injected embryos 1 min and 90 min post infection. Error bars represent standard deviations. (K) RT-PCR showing the splice effect of the Duox-Mo. (L1 and L2) Time lapse of Ca2+ signaling (beta-actin::GCaMP3.1) in a CBX injected brain before (L1) and after (L2) laser ablation (white arrowhead). (M1 and M2) microglia (pU1::Gal4-UAS-GFP) before (M1) and 120 min after (M2) central brain injury (white arrowhead) in CBX injected brains. Scale bars always: 20 μm. Images (A, D-H, L, M) were done using an Olympus FV 1000 with a 40X/NA1.15 objective. Images (I1-I3) were done using an Andor Spinning Disk Confocal with a 20x/NA0.7 objective. Images (B, C) were done using a Zeiss Axiophot with a 20X/NA0.5 objective. |
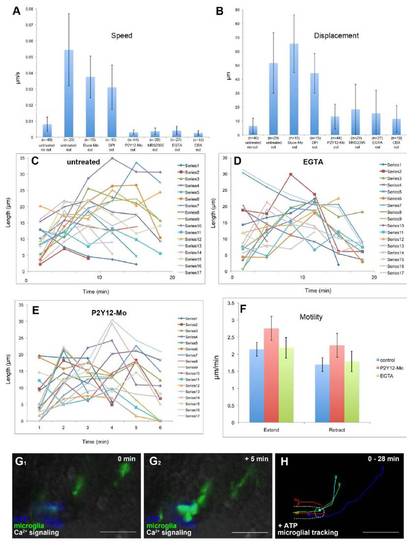
Microglial baseline motility is normal in P2Y12 knockdown and EGTA treated brains |
Reprinted from Developmental Cell, 22(6), Sieger, D., Moritz, C., Ziegenhals, T., Prykhozhij, S., and Peri, F., Long-Range Ca(2+) Waves Transmit Brain-Damage Signals to Microglia, 1138-1148, Copyright (2012) with permission from Elsevier. Full text @ Dev. Cell