
Image
|
Figure Caption
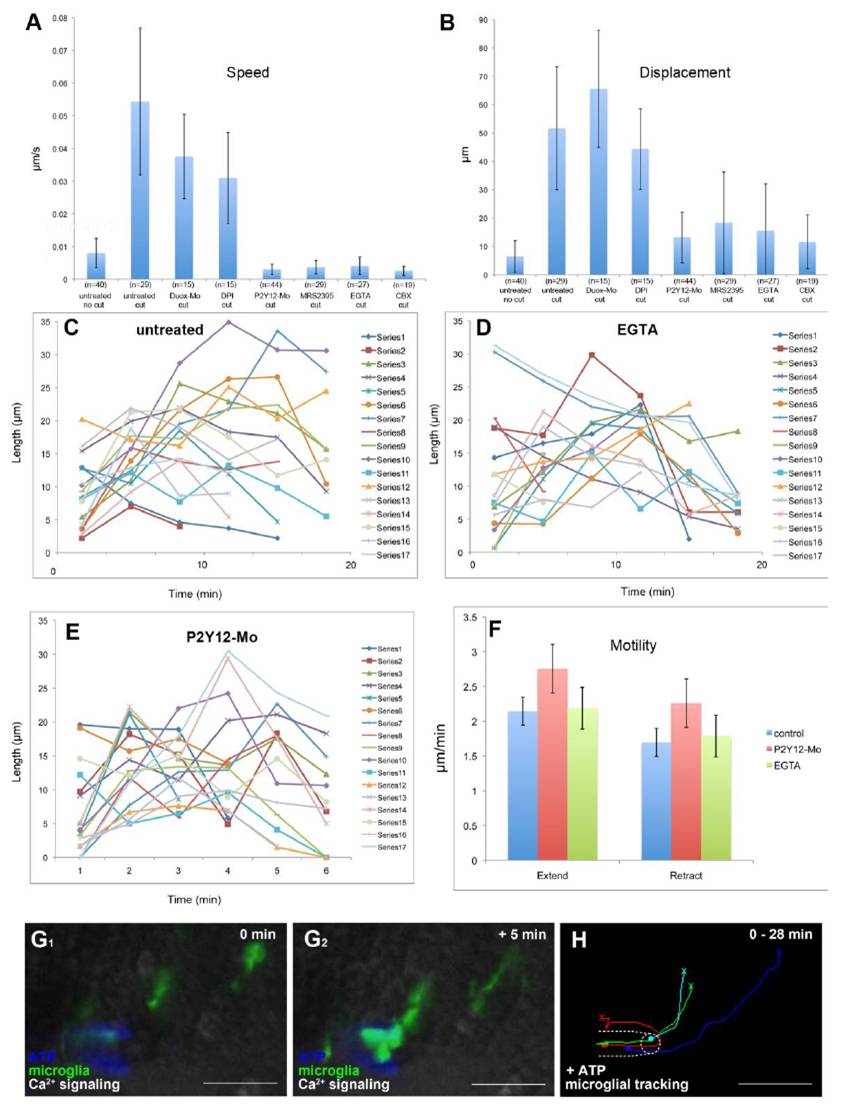
Fig. S2
Microglial baseline motility is normal in P2Y12 knockdown and EGTA treated brains
Acknowledgments
This image is the copyrighted work of the attributed author or publisher, and
ZFIN has permission only to display this image to its users.
Additional permissions should be obtained from the applicable author or publisher of the image.
Reprinted from Developmental Cell, 22(6), Sieger, D., Moritz, C., Ziegenhals, T., Prykhozhij, S., and Peri, F., Long-Range Ca(2+) Waves Transmit Brain-Damage Signals to Microglia, 1138-1148, Copyright (2012) with permission from Elsevier. Full text @ Dev. Cell