
- Title
-
Emergence of Patterned Activity in the Developing Zebrafish Spinal Cord
- Authors
- Warp, E., Agarwal, G., Wyart, C., Friedmann, D., Oldfield, C.S., Conner, A., Del Bene, F., Arrenberg, A.B., Baier, H., and Isacoff, E.Y.
- Source
- Full text @ Curr. Biol.
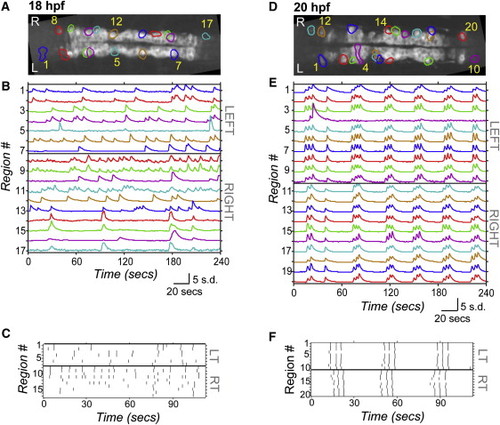
Spontaneous Calcium Activity in Spinal Neurons Progresses from Sporadic to Locomotor-Like During Embryonic Development GCaMP3 activity in single neurons in one example embryo at 18 hpf (left) and 20 hpf (right). (A and D) Dorsal views of GCaMP3 baseline fluorescence with active regions circled (rostral left; imaged area somites 4–8). (B and E) Normalized intensity traces for active regions (identified on y axis) for the left and right sides of the cord, with amplitude corresponding to standard deviations (s.d.) of fluorescence away from baseline. At 18 hpf (B), ipsilateral neurons have little correlated firing, though some synchronization is observed (e.g., cells 8 and 9). At 20 hpf (E), ipsilateral neurons are tightly synchronized, with few exceptions (e.g., cell 4; note elongated shape extending to the midline). (C and F) Raster plots of detected events for subsection of data in (B) and (E). At 18 hpf (C), population activity is uncoordinated. By 20 hpf (F), ipsilateral cells are synchronized, contralateral cells alternate, and a higher order left/right bursting organization is observed. See also Figure S1. |
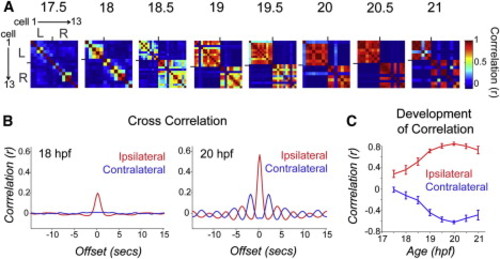
Pairwise Cell Relationships Progress from Independent to Ipsilaterally Correlated and Contralaterally Anticorrelated during a Short Period of Development (A) Correlation matrices of single-cell traces through the development of an example embryo. Each pixel represents a pairwise comparison between two cells, with high correlation values in red and perfect autocorrelation along the diagonal. Cells are sorted left to right and top to bottom as shown for 17.5 hpf. Ticks mark border between left and right cord and bound a high degree of ipsilateral correlation observed at later time points. (B) Cross-correlation shows a strengthening of ipsilateral coupling between 18 and 20 hpf and acquisition of oscillatory rhythm by 20 hpf. Cross-correlation was calculated by averaging time-shifted correlation data for all ipsilateral and contralateral cell pairs in individual movies, pooled across nine different fish. (C) Average pairwise correlations for synchronous events comparing ipsilateral and contralateral cell pairs from individual time-lapse movies acquired from fish ages 17.5 to 21 hpf and pooled across fish. We observed a significant difference between ipsilateral correlations in younger versus older embryos (18 hpf, r = 0.272 ± 0.082; 20 hpf, r = 0.761 ± 0.031; p < 10-3, paired Student′s t test; n = 9 fish) and a significant increase in the anticorrelation of contralateral cells (18 hpf, r = -0.207 ± 0.067; 20 hpf, r = -0.710 ± 0.028; p = < 10-3, paired Student′s t test; n = 9 fish). n = 9 fish for 18–21 hpf; n = 4 fish at 17.5 hpf. Error bars = SEM. See also Figure S2. |
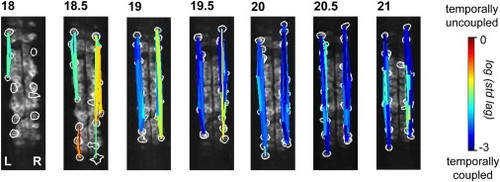
Ipsilateral Correlation Is Acquired through the Progressive Synchronization of Local Subgroups of Cells Spatial maps of correlated groups in an example fish from 18 to 21 hpf show small local circuits containing a few cells at 18 and 18.5 hpf that expand into full correlation of each side at later stages. Correlations between all cell pairs were calculated and lines were drawn between cell pairs with correlations greater than 0.2, with thicker lines representing stronger correlation. Line color represents the log of the standard deviation of the lags between event start times of cell pairs and shows an overall increase in temporal precision between ipsilateral pairs as development progresses. See also Figure S3. |
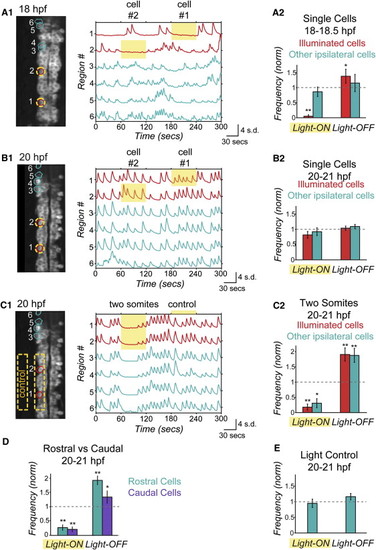
Optical Manipulation of Targeted Network Components with NpHR Reveals Changes in Functional Connectivity between Ipsilateral Neurons during Development (A and B) Single-cell optical manipulation of spontaneous activity with NpHR at 18 hpf (A) and 20 hpf (B). Illumination at 593 nm at 19 mW/mm2 is targeted successively to two regions outlined in yellow (A1, left), while calcium population activity is simultaneously recorded (A1, right) in the illuminated cells (red) and in the other ipsilateral cells (teal), and here displayed as normalized traces (standard deviation, s.d.) with regions indicated on y axis. At 18 hpf, application of yellow light to a single cell (during yellow highlight bar) inhibits only the illuminated cell, while other cells remain active (A1). Pooled results (n = 6 embryos) show inhibition during light-ON and activation at light-OFF to be limited to illuminated cells (red bars) (A2).(B) At 20 hpf, single-cell illumination has no effect on activity of either the illuminated or nonilluminated cells (n = 7 embryos).(C) At 20 hpf, illumination of one side of spinal cord in region spanning two somites (yellow outline in image, left) inhibits and rebound excites both the illuminated cells and other ipsilateral cells (n = 7 embryos). (D) Reduction of activity and rebound due to NpHR activation at 20 hpf are observed in cells that are both rostral and caudal to the region illuminated. (E) Control application of light aimed to the side of the cord but within the embryo (C1) does not perturb activity (n = 7 embryos), indicating that effect on unilluminated ipsilateral cells is not due to light scattering, though we acknowledge that light scattering may have different properties in this region. Rostral end points up in fluorescence images. Significance values from paired Student′s t-test are *p < 0.05 and **p < 0.01. See also Figures S4 and S5. |
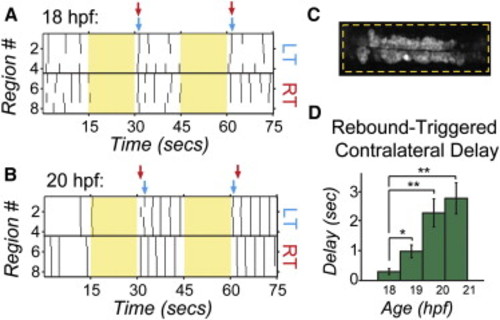
Bilateral Activation with NpHR Rebound Reveals Acquisition of Contralateral Antagonism during Development Raster plots of spontaneous events of left and right cells in a single embryo at 18 hpf (A) and 20 hpf (B) during and following bilateral NpHR inhibition with 593 nm light (yellow bars) covering approximately four somites (C). (A) Bilateral activation following NpHR inhibition at 18 hpf results in near simultaneous activation of left (LT) and right (RT) cells following light offset. Arrows indicate the time when two or more cells participate in an event following light offset for one side of the cord (left side, blue; right side, red). (B) At 20 hpf, activation at light offset of bilateral illumination results in a burst of activity in which one side fires first, followed, after a delay, by firing on the other side and continuing in alternation of firing from side to side. In this example, the right side is active first in trial 1, but the left side is active first in the trial 2. (D) The delay following offset of bilateral illumination between synchronous events on the left and right sides of the cord (two or more cells participating) increases during development, suggesting an increase in left/right antagonism. n = 5 fish (four trials per fish per condition); *p < 0.05; **p < 0.01, paired Student′s t test. See also Figure S5. |
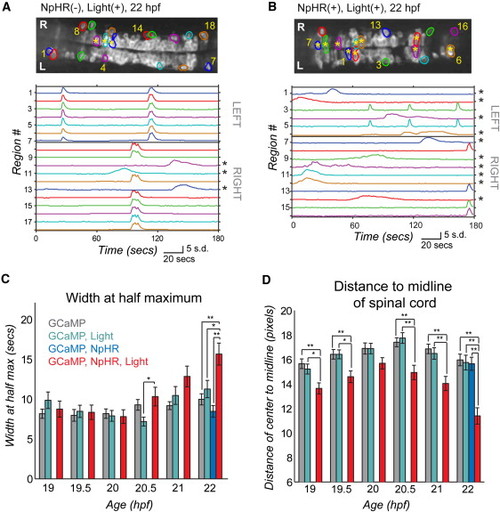
Light Inhibition Decreases the Number of Cells Joining the Correlated Network (A and B) Baseline GCaMP fluorescence images with active regions circled (top, rostral left) and associated normalized intensity traces (bottom; amplitude plots standard deviation, s.d.) in example control fish (without NpHR but illuminated with yellow/blue light protocol from 18–19 hpf) (A) and experimental fish (with NpHR and illuminated with yellow/blue light protocol from 18–19 hpf) (B) at 22 hpf. Asterisks mark cells with long-duration, uncorrelated events, which increase in number in the experimental fish (B, bottom) and can be seen to reside in the medial spinal cord (B, top). (C) Average event duration through development was quantified using width at half maximum for experimental fish expressing NpHR and receiving the yellow light protocol (GCaMP, NpHR, Light) and for the three sets of control fish: (1) lacking light and NpHR expression (GCaMP), (2) lacking NpHR expression (GCaMP, Light) or lacking light (GCaMP, NpHR). There was no difference between groups at 19, 19.5, 20, and 21 hpf (one-way ANOVA at each time point, p > 0.05), with significant differences at 20.5 and 22 hpf (one-way ANOVA at each time point, p < 0.05), when experimental fish showed increases in event duration. (D) The distance from the cell center to the midline of the cord for active cells is reduced significantly in the experimental (GCaMP, NpHR, Light) fish compared to the three controls at all ages tested except for 20 hpf (one-way ANOVA at each time point, p < 0.05). In (C) and (D), means were calculated per cell (72–137 cells per group). Error bars = SEM. Asterisks in (C) and (D) mark pairwise significance from post hoc comparison with Bonferroni correction (*p < 0.05; **p < 0.01). See also Figure S6. |
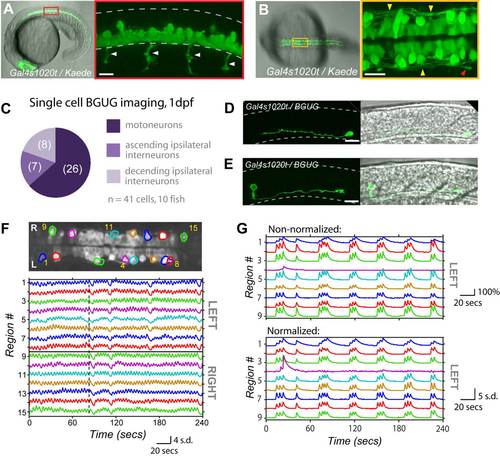
The Gal4s1020t Line Targets Ventral Spinal Neurons of the Motor System at 1 dpf which Display Locomotor-Like Patterns of Activity, Related to Figure 1 (A) Lateral view of Gal4s1020t expression pattern in a 20 hpf Gal4s1020t/UAS:Kaede embryo. (left) Low magnification showing entire embryo. (right) Zoomed view of red boxed area showing the ventral location of cell bodies and motoneuron axons (arrows) extending out of the cord. (B) Low (left) and high magnification (right) dorsal views of 20 hpf Gal4s1020t/UAS:Kaede embryo show lateral processes (yellow arrows) with a descending growth cone in view (red arrow). (C-E) Using the BGUG transgenic line1, we stochastically expressed GFP in 1-10% of the Gal4s1020t population to identify the morphology of cells targeted at 1 dpf. As at 5 dpf2, GFP expression at 1 dpf was found in motoneurons (63%), whose axons can be seen in A (arrows), and ascending ipsilateral interneurons, presumed to be KA interneurons, (17%), an example of which can be seen in (D) at 1 dpf. We also found expression in descending ipsilateral interneurons, presumed to be VeLDs (20%), an example of which (E) shows their characteristic large cell body located in the middle of the cord along the dorsal/ventral axis in a 1 dpf embryo. (F) GCaMP3 activity in an example embryo at 20.5 hpf. (top) Dorsal view of GCaMP3 baseline fluorescence with active regions circled (rostral left; imaged area somites 4-8). (bottom) Normalized intensity traces for active regions (identified on the y-axis) for the left and right sides of the cord. This fish shows very short periods of correlated quiescence between the left and right sides, with long sustained bursts alternating between the left and right sides. Dotted vertical line emphasizes alternation, passing through event peaks for left-sided cells and troughs for the right. (G) Shows nine cells from Fig. 1 before normalization (top), where traces are plotted as ΔF/F (%), and after normalization by zscore (bottom), where traces are plotted as standard deviation (s.d.) for comparison. Scale bar=20 μm for B, D, E and F. Dotted lines in A, C and D outline approximate border of spinal cord. Rostral to left. |
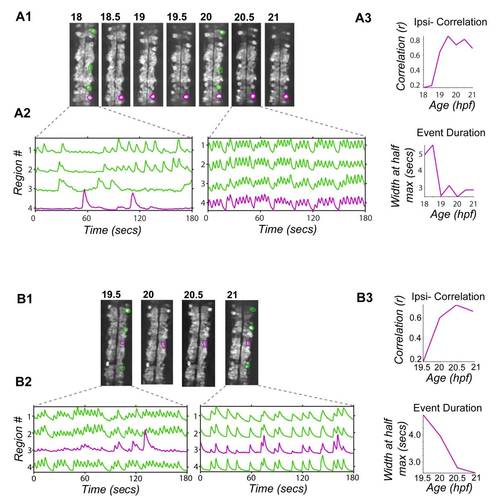
Early and Late Onset Neurons Show Increases in Correlation and Decreases in Event Duration through Development, Related to Figure 2 Single cells with detected activity onset at 18 hpf (A) and 19.5 hpf (B) tracked through consecutive time lapse movies until 21 hpf. (1) Baseline GCaMP3 fluorescence with tracked cells (purple) and other active ipsilateral cells (green) circled. (2) Normalized intensity traces (plotted as standard deviation) for tracked cells (purple) and other active ipsilateral cells (green) showing uncorrelated activity at early time points and correlated activity at later time points. (3) Correlation of tracked cells versus other ipsilateral cells increased through development for both example cells, as seen in the pooled population data (Fig. 2C). Event duration was calculated as the width at half maximum for the fitted event kernel and decreased for both examples. Rostral, up. |
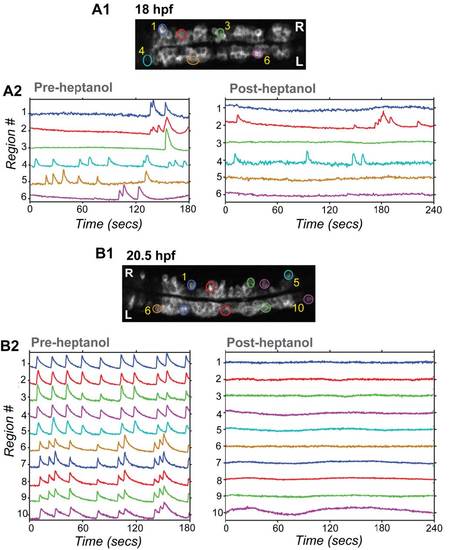
Gap Junction Blocker Heptanol Has Little Effect on Substantial Fraction of Cells in Younger Embryos, But Profoundly Blocks Activity in Older Embryos, Related to Figure 4 GCaMP3 population activity before and after heptanol treatment in an 18 (A) and 20.5 (B) hpf embryo. (1) Baseline GCaMP3 fluorescence images with cells active in pre-heptanol movies circled. (2) GCaMP3 intensity traces (ΔF/F) for these regions before (left) and after (right) 2mM heptanol treatment shows that some cells remained spontaneously active during gap junction block in the younger embryo (A2; cells 2 and 4), but no cells were active after heptanol treatment in the older embryo (B2). |
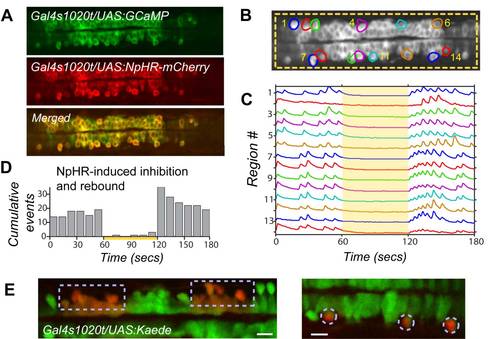
Activation of the Light-Driven Chloride Pump Halorhodopsin Robustly Inhibits Spontaneous Events and Causes Rebound Excitation, Related to Figures 4 and 5 (A) Gal4s1020t/ UAS:GCaMP3/ UAS:NpHR-mCherry fish express GCaMP3 and NpHR in the same spinal neurons. (B) Full field illumination (yellow dashed box) with 19mW/mm2 593nm light is targeted to NpHR-expressing spinal neurons while simultaneously imaging population activity with GCaMP3. (C) Spontaneous events in active regions, plotted as standard deviation, are eliminated during application of yellow light (yellow bar) in a 19 hpf fish. (D) Tallied events across several fish (n=6) shows effective inhibition when yellow light is on (yellow bar) and there is an increase in activity above baseline at light offset. (E) Accurate light targeting with the digital micro-mirror device is confirmed with the restricted photo-conversion of Kaede. Illumination with blue light (380nm) switches the fluorescence emission of Kaede from green to red22. Cells within illuminated region (boxed areas on left, single cells circled on right) convert to red while adjacent cells remain green. Though the wavelength used for NpHR activation is longer (593nm) and may scatter a little differently, we used a similar light power (15.2mW/mm2 for Kaede; 19mW/mm2 for NpHR) and exposure time (1 min). Scale bars=20μm. |