
|
Fig. 3
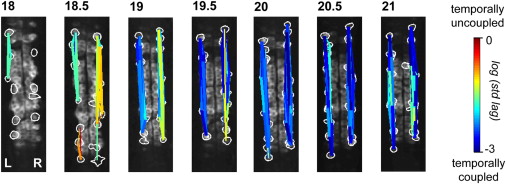
Ipsilateral Correlation Is Acquired through the Progressive Synchronization of Local Subgroups of Cells Spatial maps of correlated groups in an example fish from 18 to 21 hpf show small local circuits containing a few cells at 18 and 18.5 hpf that expand into full correlation of each side at later stages. Correlations between all cell pairs were calculated and lines were drawn between cell pairs with correlations greater than 0.2, with thicker lines representing stronger correlation. Line color represents the log of the standard deviation of the lags between event start times of cell pairs and shows an overall increase in temporal precision between ipsilateral pairs as development progresses. See also Figure S3.