
|
Fig. S1
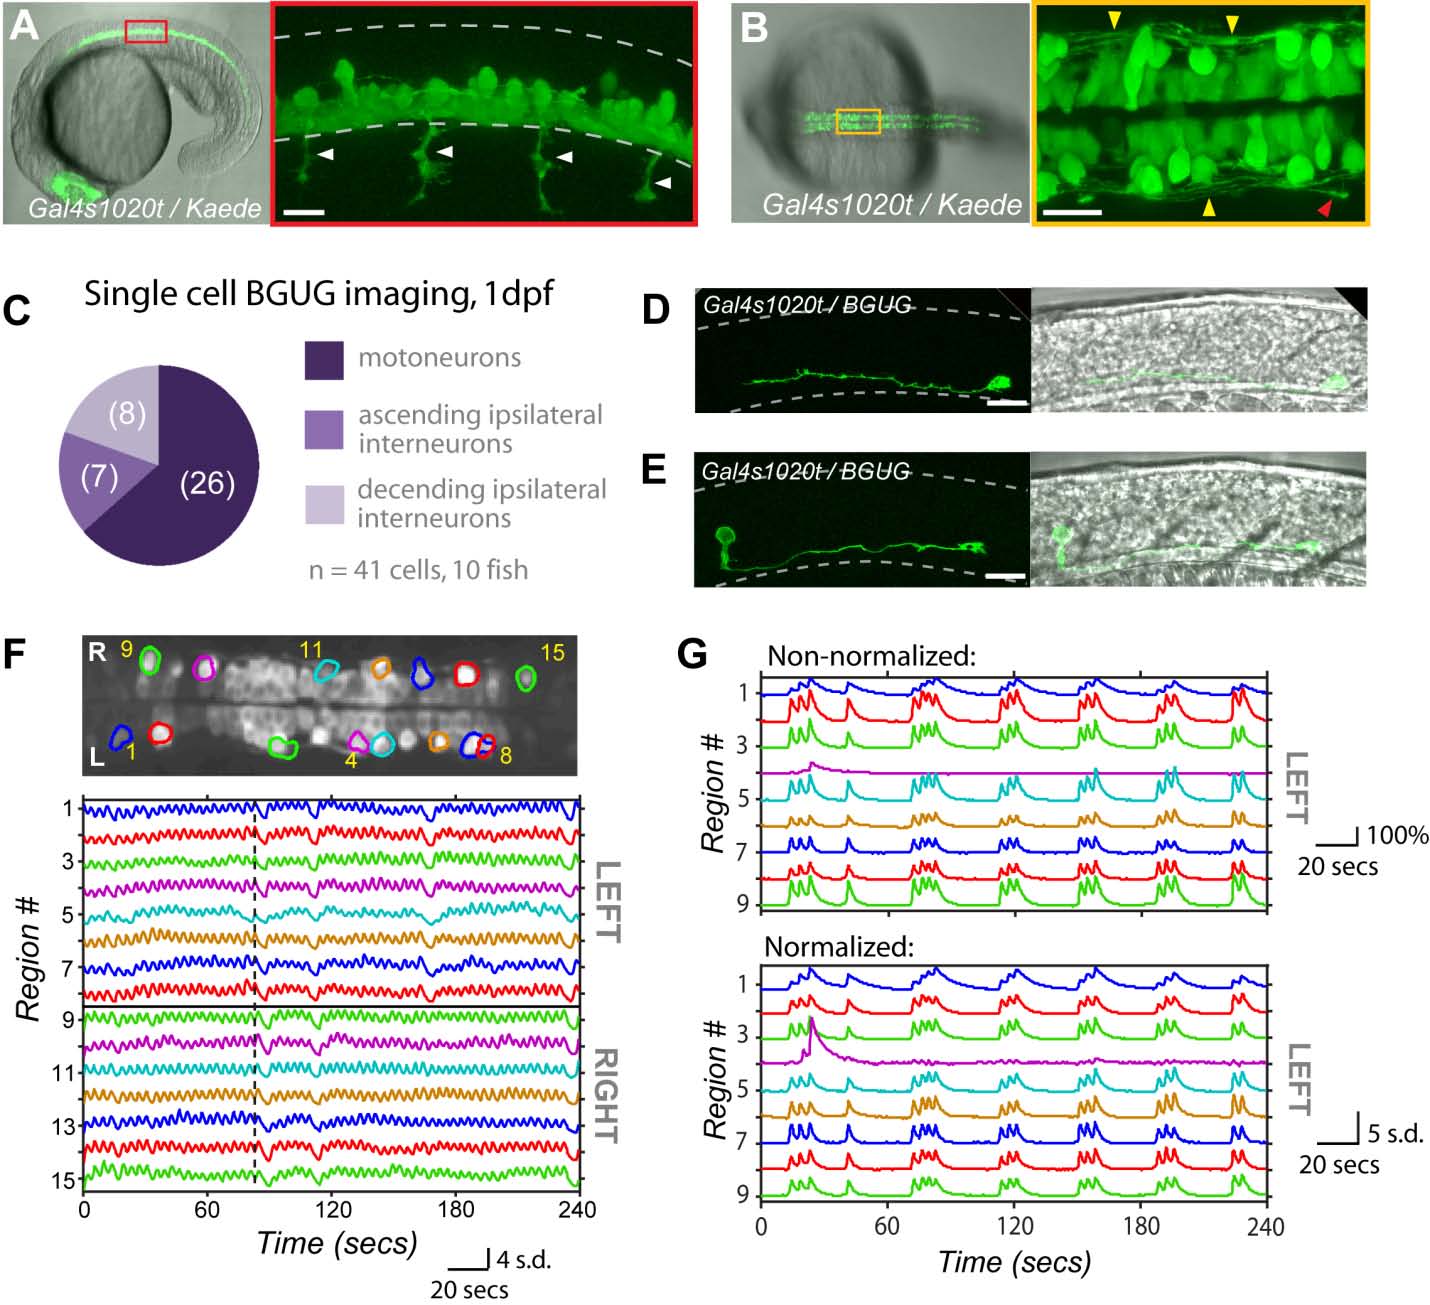
The Gal4s1020t Line Targets Ventral Spinal Neurons of the Motor System at 1 dpf which Display Locomotor-Like Patterns of Activity, Related to Figure 1
(A) Lateral view of Gal4s1020t expression pattern in a 20 hpf Gal4s1020t/UAS:Kaede embryo. (left) Low magnification showing entire embryo. (right) Zoomed view of red boxed area showing the ventral location of cell bodies and motoneuron axons (arrows) extending out of the cord.
(B) Low (left) and high magnification (right) dorsal views of 20 hpf Gal4s1020t/UAS:Kaede embryo show lateral processes (yellow arrows) with a descending growth cone in view (red arrow).
(C-E) Using the BGUG transgenic line1, we stochastically expressed GFP in 1-10% of the Gal4s1020t population to identify the morphology of cells targeted at 1 dpf. As at 5 dpf2, GFP expression at 1 dpf was found in motoneurons (63%), whose axons can be seen in A (arrows), and ascending ipsilateral interneurons, presumed to be KA interneurons, (17%), an example of which can be seen in (D) at 1 dpf. We also found expression in descending ipsilateral interneurons, presumed to be VeLDs (20%), an example of which (E) shows their characteristic large cell body located in the middle of the cord along the dorsal/ventral axis in a 1 dpf embryo.
(F) GCaMP3 activity in an example embryo at 20.5 hpf. (top) Dorsal view of GCaMP3 baseline fluorescence with active regions circled (rostral left; imaged area somites 4-8). (bottom) Normalized intensity traces for active regions (identified on the y-axis) for the left and right sides of the cord. This fish shows very short periods of correlated quiescence between the left and right sides, with long sustained bursts alternating between the left and right sides. Dotted vertical line emphasizes alternation, passing through event peaks for left-sided cells and troughs for the right.
(G) Shows nine cells from Fig. 1 before normalization (top), where traces are plotted as ΔF/F (%), and after normalization by zscore (bottom), where traces are plotted as standard deviation (s.d.) for comparison. Scale bar=20 μm for B, D, E and F. Dotted lines in A, C and D outline approximate border of spinal cord. Rostral to left.