
Fig. 7
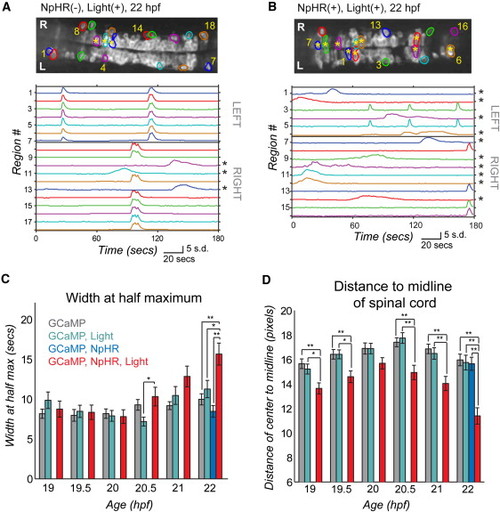
Light Inhibition Decreases the Number of Cells Joining the Correlated Network (A and B) Baseline GCaMP fluorescence images with active regions circled (top, rostral left) and associated normalized intensity traces (bottom; amplitude plots standard deviation, s.d.) in example control fish (without NpHR but illuminated with yellow/blue light protocol from 18–19 hpf) (A) and experimental fish (with NpHR and illuminated with yellow/blue light protocol from 18–19 hpf) (B) at 22 hpf. Asterisks mark cells with long-duration, uncorrelated events, which increase in number in the experimental fish (B, bottom) and can be seen to reside in the medial spinal cord (B, top). (C) Average event duration through development was quantified using width at half maximum for experimental fish expressing NpHR and receiving the yellow light protocol (GCaMP, NpHR, Light) and for the three sets of control fish: (1) lacking light and NpHR expression (GCaMP), (2) lacking NpHR expression (GCaMP, Light) or lacking light (GCaMP, NpHR). There was no difference between groups at 19, 19.5, 20, and 21 hpf (one-way ANOVA at each time point, p > 0.05), with significant differences at 20.5 and 22 hpf (one-way ANOVA at each time point, p < 0.05), when experimental fish showed increases in event duration. (D) The distance from the cell center to the midline of the cord for active cells is reduced significantly in the experimental (GCaMP, NpHR, Light) fish compared to the three controls at all ages tested except for 20 hpf (one-way ANOVA at each time point, p < 0.05). In (C) and (D), means were calculated per cell (72–137 cells per group). Error bars = SEM. Asterisks in (C) and (D) mark pairwise significance from post hoc comparison with Bonferroni correction (*p < 0.05; **p < 0.01). See also Figure S6. |