
Fig. S2
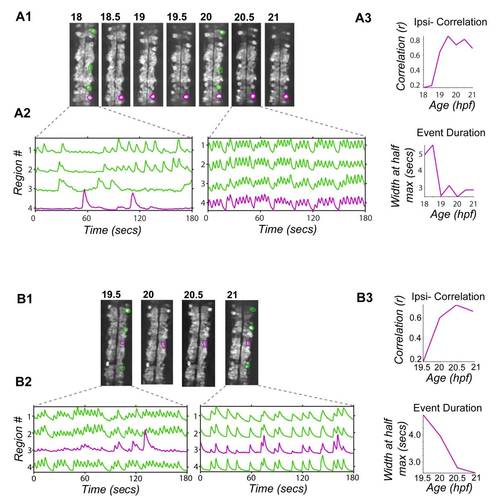
Early and Late Onset Neurons Show Increases in Correlation and Decreases in Event Duration through Development, Related to Figure 2 Single cells with detected activity onset at 18 hpf (A) and 19.5 hpf (B) tracked through consecutive time lapse movies until 21 hpf. (1) Baseline GCaMP3 fluorescence with tracked cells (purple) and other active ipsilateral cells (green) circled. (2) Normalized intensity traces (plotted as standard deviation) for tracked cells (purple) and other active ipsilateral cells (green) showing uncorrelated activity at early time points and correlated activity at later time points. (3) Correlation of tracked cells versus other ipsilateral cells increased through development for both example cells, as seen in the pooled population data (Fig. 2C). Event duration was calculated as the width at half maximum for the fitted event kernel and decreased for both examples. Rostral, up. |