
Fig. 4
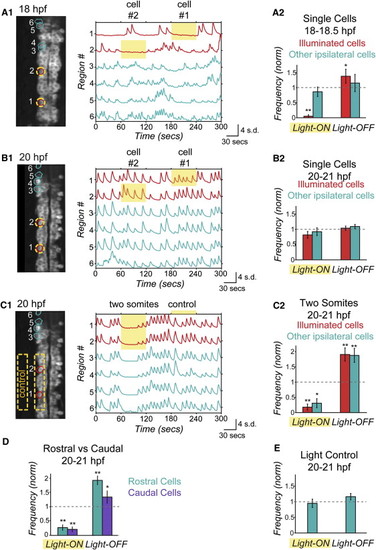
Optical Manipulation of Targeted Network Components with NpHR Reveals Changes in Functional Connectivity between Ipsilateral Neurons during Development (A and B) Single-cell optical manipulation of spontaneous activity with NpHR at 18 hpf (A) and 20 hpf (B). Illumination at 593 nm at 19 mW/mm2 is targeted successively to two regions outlined in yellow (A1, left), while calcium population activity is simultaneously recorded (A1, right) in the illuminated cells (red) and in the other ipsilateral cells (teal), and here displayed as normalized traces (standard deviation, s.d.) with regions indicated on y axis. At 18 hpf, application of yellow light to a single cell (during yellow highlight bar) inhibits only the illuminated cell, while other cells remain active (A1). Pooled results (n = 6 embryos) show inhibition during light-ON and activation at light-OFF to be limited to illuminated cells (red bars) (A2).(B) At 20 hpf, single-cell illumination has no effect on activity of either the illuminated or nonilluminated cells (n = 7 embryos).(C) At 20 hpf, illumination of one side of spinal cord in region spanning two somites (yellow outline in image, left) inhibits and rebound excites both the illuminated cells and other ipsilateral cells (n = 7 embryos). (D) Reduction of activity and rebound due to NpHR activation at 20 hpf are observed in cells that are both rostral and caudal to the region illuminated. (E) Control application of light aimed to the side of the cord but within the embryo (C1) does not perturb activity (n = 7 embryos), indicating that effect on unilluminated ipsilateral cells is not due to light scattering, though we acknowledge that light scattering may have different properties in this region. Rostral end points up in fluorescence images. Significance values from paired Student′s t-test are *p < 0.05 and **p < 0.01. See also Figures S4 and S5. |