
Fig. 5
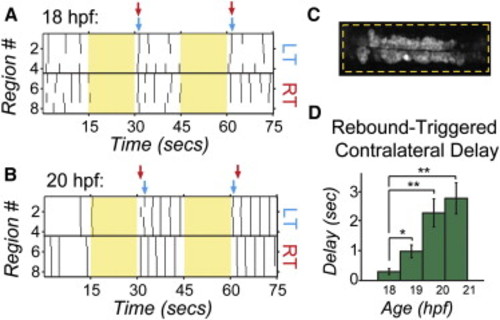
Bilateral Activation with NpHR Rebound Reveals Acquisition of Contralateral Antagonism during Development Raster plots of spontaneous events of left and right cells in a single embryo at 18 hpf (A) and 20 hpf (B) during and following bilateral NpHR inhibition with 593 nm light (yellow bars) covering approximately four somites (C). (A) Bilateral activation following NpHR inhibition at 18 hpf results in near simultaneous activation of left (LT) and right (RT) cells following light offset. Arrows indicate the time when two or more cells participate in an event following light offset for one side of the cord (left side, blue; right side, red). (B) At 20 hpf, activation at light offset of bilateral illumination results in a burst of activity in which one side fires first, followed, after a delay, by firing on the other side and continuing in alternation of firing from side to side. In this example, the right side is active first in trial 1, but the left side is active first in the trial 2. (D) The delay following offset of bilateral illumination between synchronous events on the left and right sides of the cord (two or more cells participating) increases during development, suggesting an increase in left/right antagonism. n = 5 fish (four trials per fish per condition); *p < 0.05; **p < 0.01, paired Student′s t test. See also Figure S5. |