
- Title
-
Zebrafish mnx1 controls cell fate choice in the developing endocrine pancreas
- Authors
- Dalgin, G., Ward, A.B., Hao le, T., Beattie, C.E., Nechiporuk, A., and Prince, V.E.
- Source
- Full text @ Development
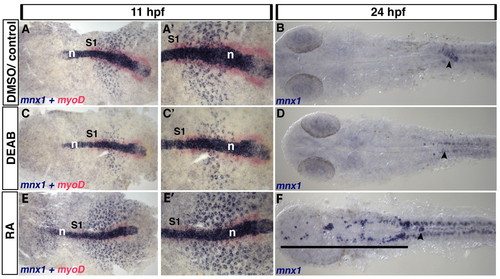
Endoderm expression of mnx1 is regulated by retinoic acid. (A-F) Control zebrafish embryos were treated with DMSO carrier (A,A′) or untreated (B). Retinoic acid (RA) signaling was blocked by DEAB treatment (C-D) or elevated by RA treatment (E-F). (A,C,E) In situ hybridization for mnx1 at 11 hpf shows punctate expression of mnx1 transcripts (blue) in the endoderm and high levels of expression in notochord. In situ hybridization for the mesodermal marker myod1 (myoD, red) marks the adaxial mesoderm at this stage up to the first somite (S1). (A2,C2,E2) Higher magnification views of A,C,E. At 24 hpf, mnx1 transcripts are localized to presumptive endocrine pancreas (B). DEAB treatment reduces the endodermal expression of mnx1 at 11 hpf (C,C′) and abolishes it at 24 hpf (arrowhead), whereas RA treatment increases the number of cells expressing mnx1 at 11 hpf (E,E′) and expands the mnx1-expressing pancreatic domain (arrowhead) towards the anterior (black line). Note that neither the notochord (A,C,E) nor the spinal cord motoneurons (B,D,F) show altered mnx1 expression in response to modulation of RA signaling. n, notochord. EXPRESSION / LABELING:
PHENOTYPE:
|
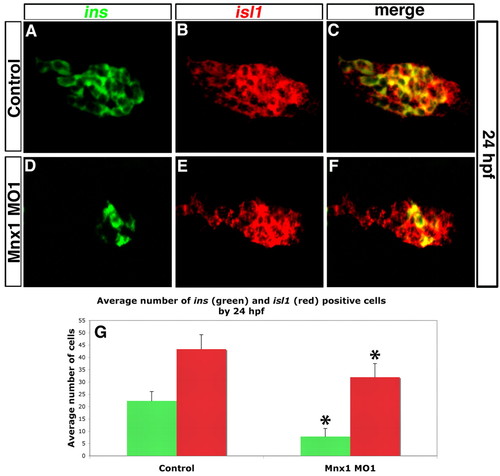
Mnx1-deficient embryos have endocrine pancreas defects. (A-F) Confocal images of the dorsal pancreatic bud at 24 hpf. ins (green) and isl1 (red) transcripts were detected by double-fluorescent in situ hybridization (FISH) in control (A-C) or Mnx1 MO1-injected (D-F) zebrafish embryos. Anterior to left. (G) Mean (± s.d.) number of cells positive for insulin (ins) or isl1 (red) in control and mnx1 morphants. *, P<0.001 (t-test, two-tailed distribution, Bonferroni correction); control, n=35; Mnx1 MO1, n=50. |
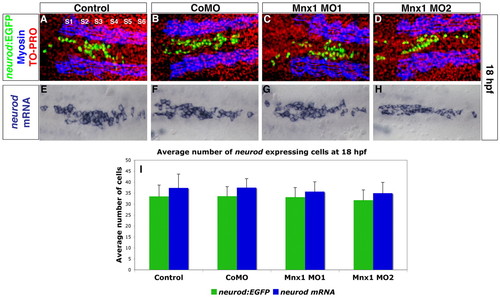
Endocrine progenitors are unaffected by Mnx1 knockdown. (A-D) Confocal images of Tg(neurod:EGFP) zebrafish embryos at 18 hpf. Whole-mount immunolabeling for GFP (green) and for myosin to label somites (blue); nuclear staining with TO-PRO-3 (red). Somites are numbered from anterior to posterior (S1-S6). (E-H) In situ hybridization for neurod at 18 hpf. (A,E) Uninjected controls; (B,F) control morphants; (C,G) Mnx1 MO1-injected embryos; (D,H) Mnx1 MO2-injected embryos. (I) Mean (± s.d.) neurod-expressing cells from two independent experiments and from a minimum of 17 embryos per group. EXPRESSION / LABELING:
PHENOTYPE:
|
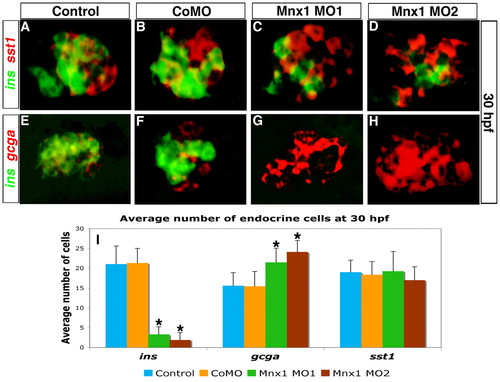
Mnx1-deficient embryos lack beta cells but gain alpha cells. (A-H) Confocal images of the dorsal pancreatic bud at 30 hpf showing double FISH for (A-D) ins (green) and somatostatin (sst1, red) or (E-H) ins (green) and glucagon (gcga, red) in zebrafish embryos that were uninjected (A,E) or injected with control MO (B,F), Mnx1 MO1 (C,G) or Mnx1 MO2 (D,H). (I) Mean (± s.d.) number of cells expressing the three markers. *, P<0.001 (t-test, two-tailed distribution, Bonferroni correction). Results are from three independent experiments with a minimum of ten embryos per group. CoMO, control MO. |
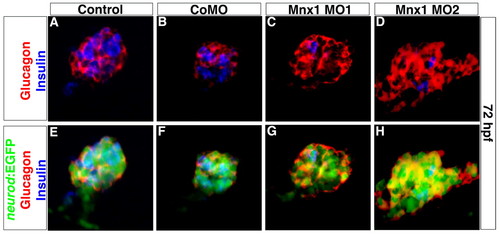
The altered balance of alpha and beta cells in Mnx1-deficient embryos is maintained after ventral bud development. Confocal images of whole-mount 72 hpf Tg(neurod:EGFP) zebrafish embryos that were (A,E) uninjected, or injected with (B,F) control MO, (C,G) Mnx1 MO1 or (D,H) Mnx1 MO2, immunolabeled for glucagon (red), insulin (blue) and GFP (green) as indicated. Data are representative of three independent experiments. EXPRESSION / LABELING:
PHENOTYPE:
|
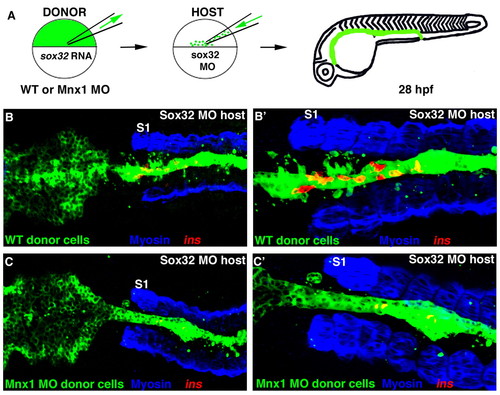
Mnx1 functions directly in the endoderm to promote beta cell fate. (A) The cell transplantation approach. Wild-type zebrafish embryos were injected with fluorescein dextran (green) together with either sox32 mRNA or sox32 mRNA and Mnx1 MO. Control or morphant donor cells were transplanted into sox32 morphant hosts then raised until 28 hpf. (B-C′) Confocal images of representative 28 hpf control (B,B′) and Mnx1 MO (C,C′) transplants, at low (B,C) and higher (B′,C′) magnification, showing whole-mount immunostaining for myosin (blue) and in situ hybridization for insulin (red). S1, first somite. Anterior to left. Control, n=12; Mnx1 MO, n=13. |
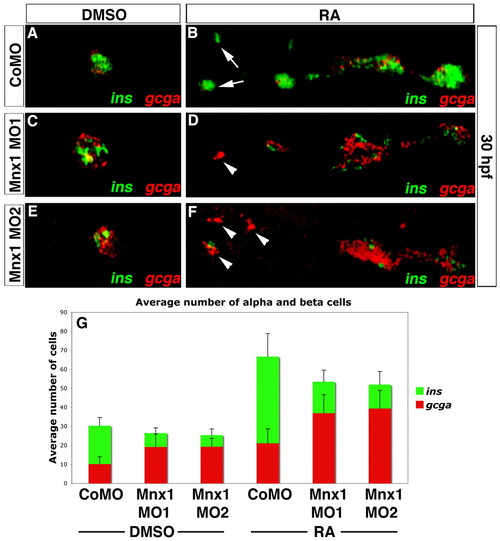
Mnx1 knockdown alters the alpha:beta cell ratio in a similar fashion in control and RA-treated embryos. (A-F) Confocal images of DMSO carrier-treated (A,C,E) and RA-treated (B,D,F) 30 hpf zebrafish embryos that were injected with control MO (A,B), Mnx1 MO1 (C,D) or Mnx1 MO2 (E,F), showing double FISH for ins (green) and gcga (red). Arrows indicate beta cells and arrowheads indicate alpha cells. (G) Mean (± s.d.) number of alpha and beta cells from four independent experiments with a minimum of 45 embryos per group. Anterior to left. |
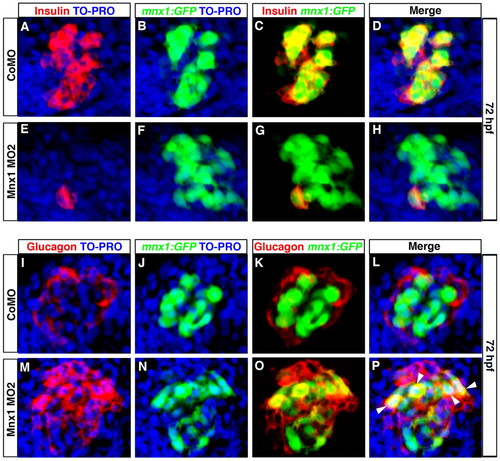
Beta cell progenitors take on an alpha cell fate in Mnx1-deficient embryos. (A-P) Confocal images of 72 hpf Tg(mnx1:GFP) zebrafish embryos injected with control MO (A-D,I-L) or Mnx1 MO2 (E-H,M-P). (A-H) Whole-mount immunolabeling for GFP (green) and insulin (red), with nuclear staining with TO-PRO-3 (blue). (I-P) Whole-mount immunostaining for GFP (green) and glucagon (red), with nuclear staining with TO-PRO-3 (blue). Arrowheads indicate colocalization of glucagon and GFP. Data are representative of three independent experiments with a minimum of 20 embryos per group. EXPRESSION / LABELING:
PHENOTYPE:
|
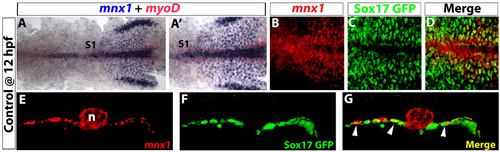
Early expression of mnx1 is localized in pre-pancreatic endoderm. (A-D) Ventral view of 12 hpf Tg(sox17:EGFP) embryos. (A) In situ hybridization for mnx1 (blue) and myoD (red). (A′) High-magnification view. (B-D) Confocal images of mnx1 transcripts (fluorescent images of chromogenic in situ hybridizations, see Material and methods) in A,A′ (B) and GFP immunostaining (C); colocalization of mnx1 transcripts and GFP is observed (D). (E-G) Vibratome section (100 µm) taken through the level of somite 1 (see A,A′). Confocal z-stacks of mnx1 expression (E), GFP labeling (F) and merged images (G) are shown to demonstrate endodermal expression of mnx1 (arrowheads in G). Anterior to the left. S1, somite 1; n, notochord. |
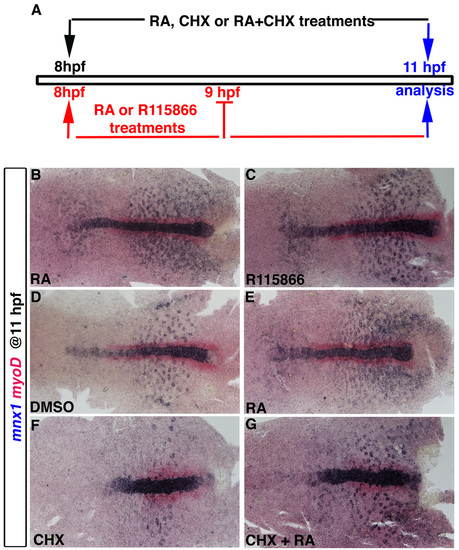
Protein translation is not required for RA to induce mnx1 expression. (A) Schematic representation of pharmacological treatments. For experiments shown in B and C, embryos were treated with 1 μM RA or 10 μM R115866 an inhibitor of Cyp26 function (Kinkel et al., 2009) for 1 hour, reagents were removed at 9 hpf, and embryos fixed for analysis at 11 hpf. For experiments shown in E-G, embryos were treated with 1 μM RA or with 50 μg/ml CHX (Poulain and Lepage, 2002), or with both RA and CHX together, at 8 hpf for 3 hours until embryos were fixed for analysis at 11 hpf. (B-G) Whole-mount in situ hybridization for mnx1 (blue) and myoD (red). Anterior to left. |
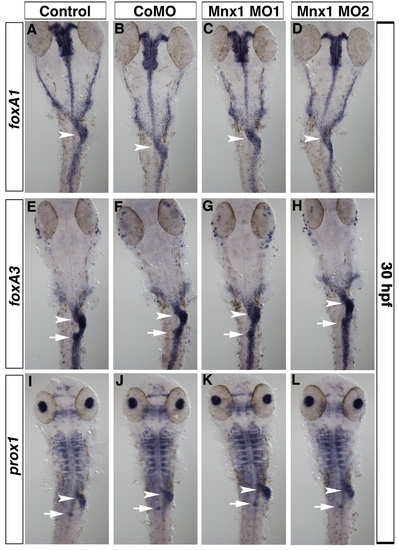
Gut morphology is unaffected by Mnx1 knockdown. (A-L) Ventral views of 30 hpf uninjected control embryos (A,E,I), control MO-injected (B,F,J), Mnx1 MO1-injected (C,G,K) and Mnx1 MO2-injected (D,H,L) embryos. Whole-mount in situ hybridizations for gut markers foxA1 (A-D), foxA3 (E-H) and prox1 (I-J). All embryos from each group showed similar patterns for each marker analyzed (minimum nine embryos per group). Siblings from each group were analyzed to confirm the expected decrease in insulin expression. Arrowheads indicate liver and arrows indicate dorsal pancreas region. |
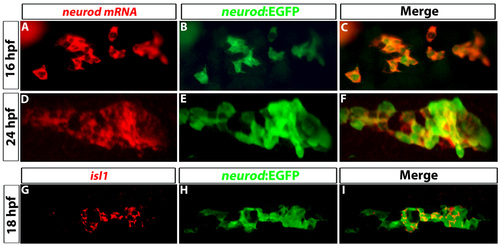
Tg(neurod:EGFP) expression colocalizes with neurod and isl1 transcripts. (A-F) Confocal images of prospective dorsal bud cells at (A-C) 16 hpf and (D-F) 24 hpf. (A,D) FISH for neurod transcripts (red) and (B,F) immunostaining to detect GFP (green) from Tg(neurod:EGFP). (C,F) Colocalization of neurod transcripts and GFP. (G-I) Confocal images of 18 hpf embryos. (G) In situ hybridization for isl1; (H) immunostaining for GFP to detect Tg(neurod:EGFP); (I) colocalization of isl1 transcripts and GFP. |
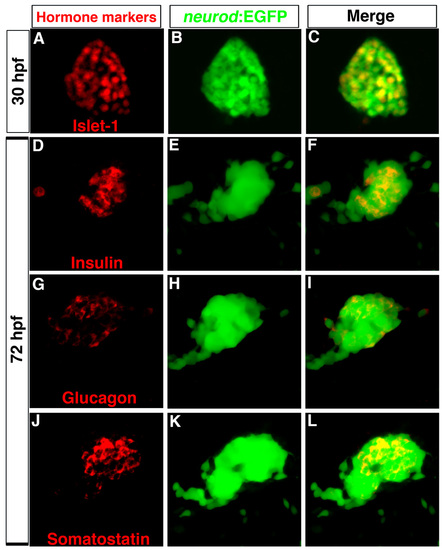
Tg(neurod:EGFP) is an endocrine progenitor marker. (A-C) Confocal image of 30 hpf dorsal pancreas. (A) Immunostaining to detect Islet1 (red) and (B) GFP (green); (C) colocalization of Islet1 and GFP. (D-L) Confocal images of 72 hpf embryos showing primary islets. Immunostaining for (D) insulin, (G) glucagon, (J) somatostatin, and (E,H,K) GFP. (F,I,L) Colocalization of hormones and GFP. Anterior to left. |
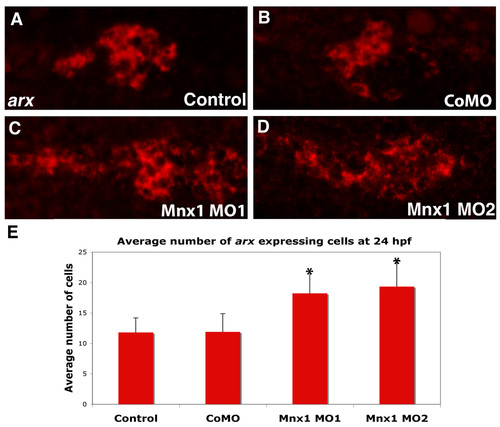
Mnx1-deficient embryos have expanded expression of the arx alpha cell marker. (A-D) Whole-mount in situ hybridization for arx; fluorescent images of chromogenic in situ hybridizations. Ventral view of 24 hpf (A) uninjected control, (B) control MO-injected, (C) Mnx1 MO1-injected and (D) Mnx1 MO2-injected embryos. Anterior to left. (E) Mean (± s.d.) number of arx-expressing cells. *, P<0.001 (t-test, two-tailed distribution, Bonferroni correction), from a minimum of 11 embryos per group. |
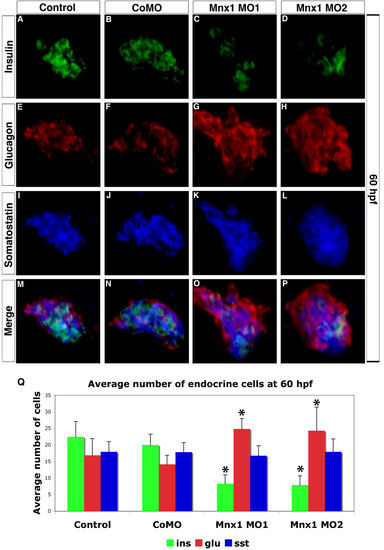
Altered balance of hormone producing cells is maintained in 60 hpf mnx1 morphants. (A-P) Confocal images of primary pancreatic islet from 60 hpf wild-type (AB) embryos. Immunolabeling for (A-D) insulin, (E-H) glucagon, (I-L) somatostatin and (M-P) colocalization of all three hormones. Note disorganized primary islets in mnx1 morphants (O,P). (Q) Mean (± s.d.) number of endocrine cells. *, P<0.001 (t-test, two-tailed distribution, Bonferroni correction). Results are from a minimum of 15 embryos per group. |
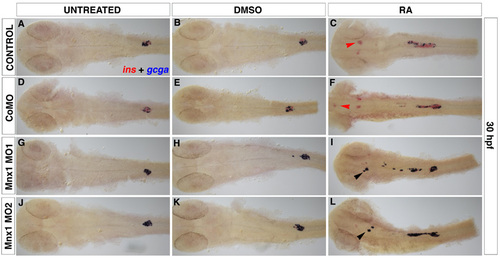
Chromogenic analysis confirms that Mnx1 knockdown alters alpha:beta cell ratios in a similar fashion in untreated and RA-treated embryos. Ventral images of 30 hpf embryos. In situ hybridizations for insulin (ins, red) and glucagon (gcga, blue). (A,D,G,J) Untreated embryos, (B,E,H,K) DMSO-treated and (C,F,I,L) RA-treated embryos. Red arrowheads indicate insulin-expressing cells and black arrowheads indicate glucagon-expressing cells in the head endoderm region. |
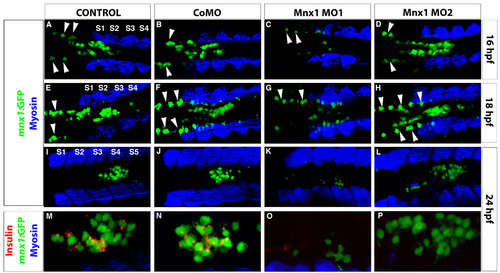
Mnx1 MO1 but not Mnx1 MO2 disrupts Tg(mnx1:GFP) expression. (A-P) Confocal images of Tg(mnx1:GFP) embryos at (A-D) 16 hpf, (E-H) 18 hpf and (I-P) 24 hpf. (A-L) Immunolabeling with GFP and myosin antibodies. Endodermal Tg(mnx1:GFP) cells (green) are observed in the midline adjacent to somites (S) (blue). Dorsally localized GFP-expressing cells anterior to the somites are motoneurons (arrowheads). (M-P) Higher magnifications. (I-L) Colabeling of GFP cells with insulin antibody (red). |
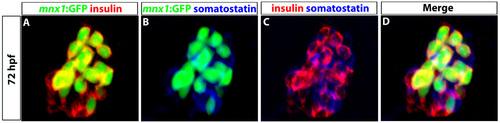
Tg(mnx1:GFP) cells do not take on a delta cell fate. (A-D) Confocal images of 72 hpf Tg(mnx1:GFP) embryos showing primary islet. GFP (green, A,B,D), insulin (red, A,C,D) and somatostatin (blue, B-D) antibodies were used to detect Tg(mnx1:GFP), beta and delta cells, respectively. |