
Image
|
Figure Caption
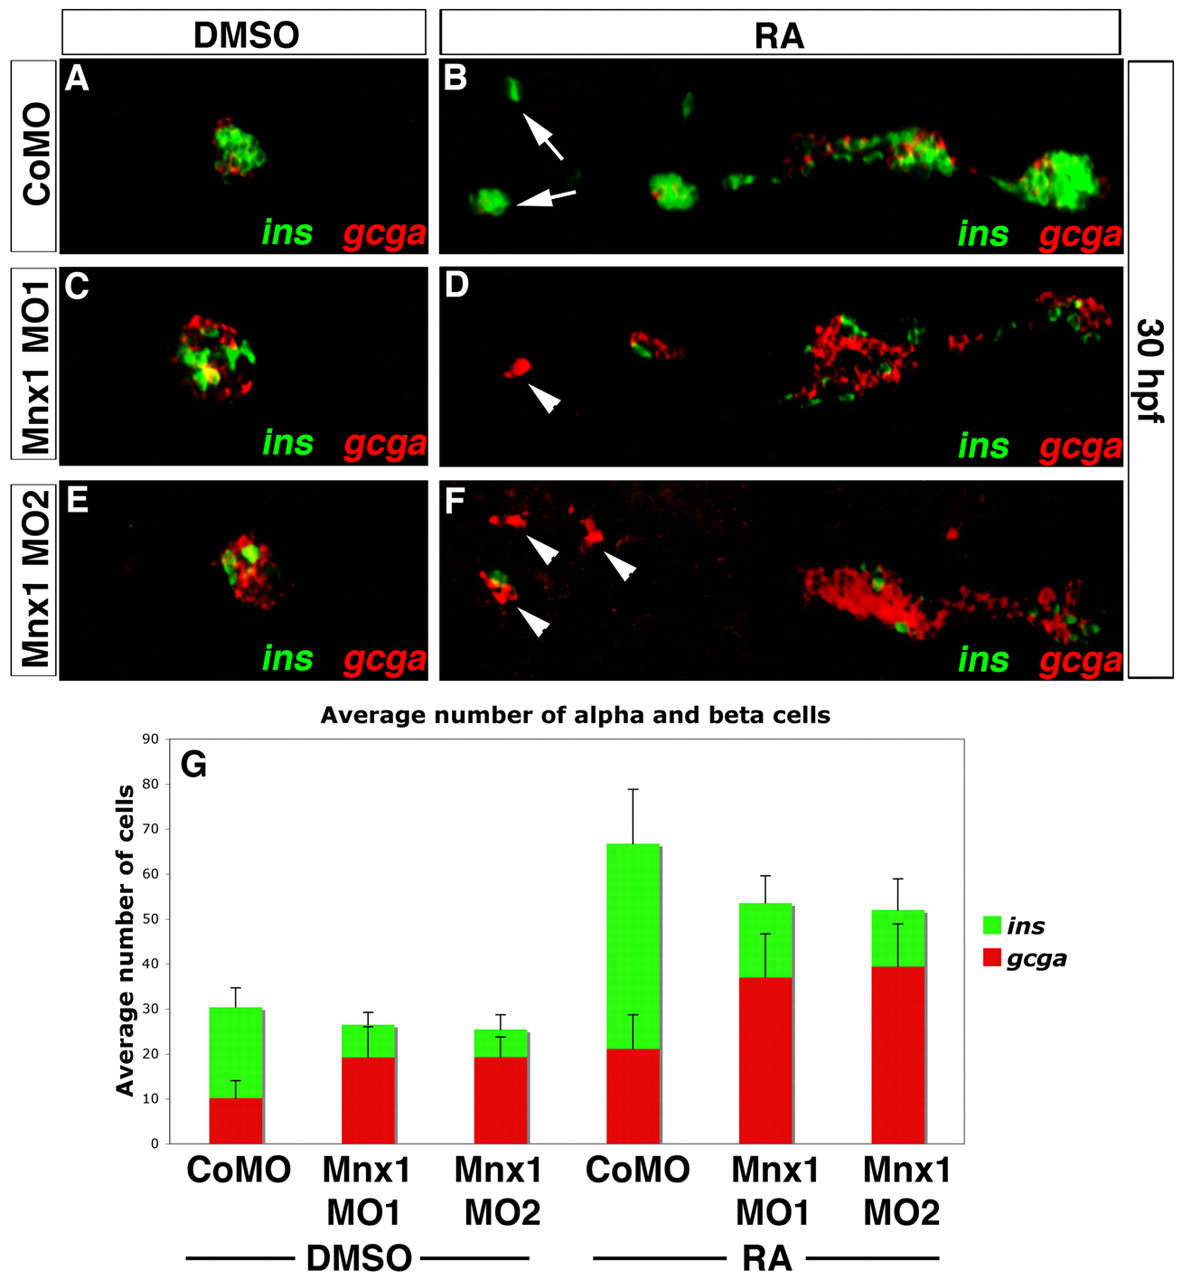
Fig. 7 Mnx1 knockdown alters the alpha:beta cell ratio in a similar fashion in control and RA-treated embryos. (A-F) Confocal images of DMSO carrier-treated (A,C,E) and RA-treated (B,D,F) 30 hpf zebrafish embryos that were injected with control MO (A,B), Mnx1 MO1 (C,D) or Mnx1 MO2 (E,F), showing double FISH for ins (green) and gcga (red). Arrows indicate beta cells and arrowheads indicate alpha cells. (G) Mean (± s.d.) number of alpha and beta cells from four independent experiments with a minimum of 45 embryos per group. Anterior to left.
Figure Data
Acknowledgments
This image is the copyrighted work of the attributed author or publisher, and
ZFIN has permission only to display this image to its users.
Additional permissions should be obtained from the applicable author or publisher of the image.
Full text @ Development