
Image
|
Figure Caption
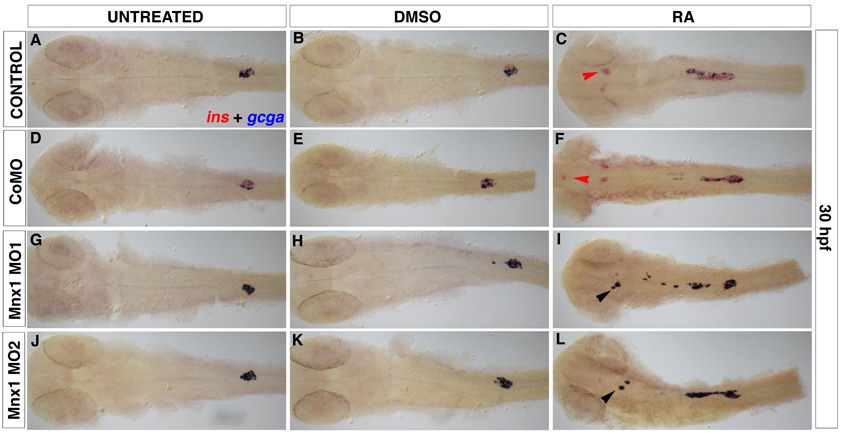
Fig. S8 Chromogenic analysis confirms that Mnx1 knockdown alters alpha:beta cell ratios in a similar fashion in untreated and RA-treated embryos. Ventral images of 30 hpf embryos. In situ hybridizations for insulin (ins, red) and glucagon (gcga, blue). (A,D,G,J) Untreated embryos, (B,E,H,K) DMSO-treated and (C,F,I,L) RA-treated embryos. Red arrowheads indicate insulin-expressing cells and black arrowheads indicate glucagon-expressing cells in the head endoderm region.
Acknowledgments
This image is the copyrighted work of the attributed author or publisher, and
ZFIN has permission only to display this image to its users.
Additional permissions should be obtained from the applicable author or publisher of the image.
Full text @ Development