
Image
|
Figure Caption
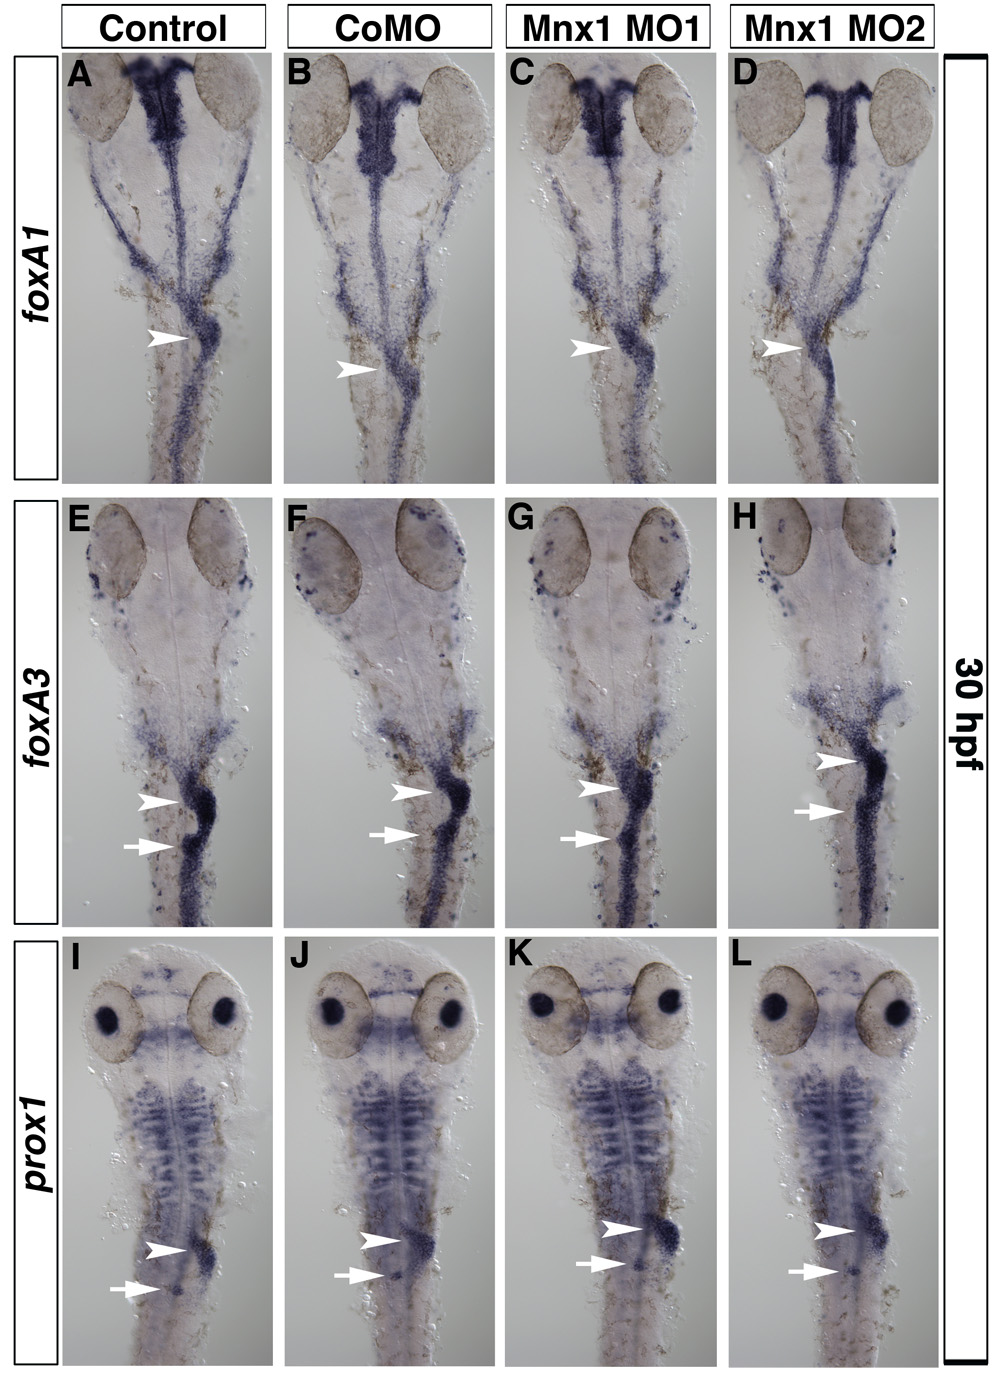
Fig. S3 Gut morphology is unaffected by Mnx1 knockdown. (A-L) Ventral views of 30 hpf uninjected control embryos (A,E,I), control MO-injected (B,F,J), Mnx1 MO1-injected (C,G,K) and Mnx1 MO2-injected (D,H,L) embryos. Whole-mount in situ hybridizations for gut markers foxA1 (A-D), foxA3 (E-H) and prox1 (I-J). All embryos from each group showed similar patterns for each marker analyzed (minimum nine embryos per group). Siblings from each group were analyzed to confirm the expected decrease in insulin expression. Arrowheads indicate liver and arrows indicate dorsal pancreas region.
Acknowledgments
This image is the copyrighted work of the attributed author or publisher, and
ZFIN has permission only to display this image to its users.
Additional permissions should be obtained from the applicable author or publisher of the image.
Full text @ Development