
- Title
-
Long-range gene regulation links genomic type 2 diabetes and obesity risk regions to HHEX, SOX4, and IRX3
- Authors
- Ragvin, A., Moro, E., Fredman, D., Navratilova, P., Drivenes, O., Engström, P.G., Alonso, M.E., Mustienes, E.D., Gomez Skarmeta, J.L., Tavares, M.J., Casares, F., Manzanares, M., van Heyningen, V., Molven, A., Njølstad, P.R., Argenton, F., Lenhard, B., and Becker, T.S.
- Source
- Full text @ Proc. Natl. Acad. Sci. USA
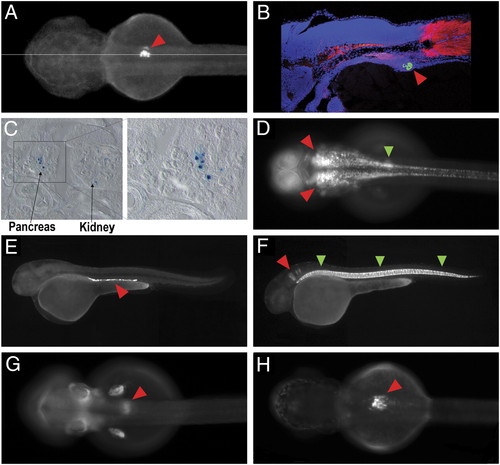
Reporter expression patterns directed by noncoding elements from T2D risk regions. (A and B) Live dorsal image (A) and cryosection (B) of a 72-hpf transgenic zebrafish showing GFP-reporter expression driven by the Xenopus element equivalent to the rs1111875-containing human HCNE downstream of HHEX (element 1). Red arrowheads point to the pancreatic anlagen. The horizontal line in (A) shows the level of section in B. The cryosection (B) was stained for DNA using DAPI (blue), for muscle actin using rhodamine-phalloidin (red) and for GFP using anti-GFP (green). (C) Sections through the pancreas of a 14.5-d mouse transgenic for rs1111875-containing human HCNE downstream of HHEX (element 1). LacZ staining is seen in the pancreatic anlagen. (D) Live dorsal image of a 48-hpf transgenic zebrafish showing GFP-reporter expression driven by the human HCNE closest to rs7754840 in CDKAL1 (element 2). Arrowheads point to expression in the hindbrain (red) and the primordium of the swim bladder (green). (E and F). Live lateral images of 48-hpf transgenic zebrafish showing GFP-reporter expression driven by the most deeply conserved HCNEs in the obesity-associated LD block of FTO. Element 3 (E) drives expression in the pronephric duct (red arrowhead), whereas element 4 (F) drives expression in the notochord (green arrowheads) and in hindbrain rhombomeres (red arrowhead). (G and H) Live dorsal images of 48-hpf transgenic zebrafish showing GFP-reporter expression driven by the rs1421085-containing HCNE and the rs9939609- containing HCNE in the FTO intron 1. Red arrowheads point to expression in the pancreatic area. EXPRESSION / LABELING:
|
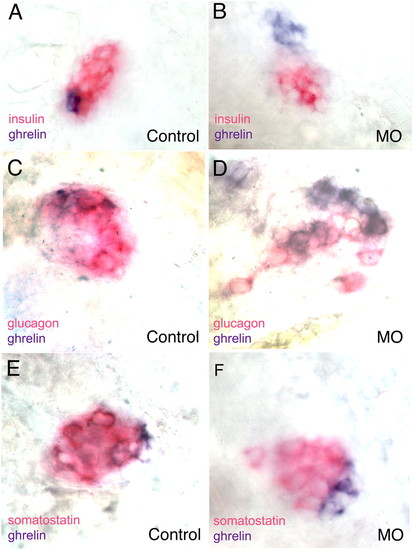
Pancreatic buds of 48-hpf zebrafish embryos showing a reduction in the number of insulin-expressing cells and an increase of ghrelin-expressing cells in irx3a morphants. In situ hybridization with insulin (red) and ghrelin (blue) probes on control (A) and irx3a morphant embryos (B). Statistical support for the observation is given in Table 3. (C and D) irx3a morphants display a reduction in pancreatic α-cells. In situ hybridization with glucagon (red in C and D), somatostatin (red in E and F), and ghrelin (blue in C–F) probes on control (C and E) and irx3a morphant embryos (D and F). showing reduction in the number of α-cells (D) and increase of ghrelin-expressing cells (D and F) in the pancreatic bud of 48-hpf irx3a morphant embryos. The number of δ-cells is unaffected. Embryos are in ventral view. Statistical support for the observation is given in Table 4. |
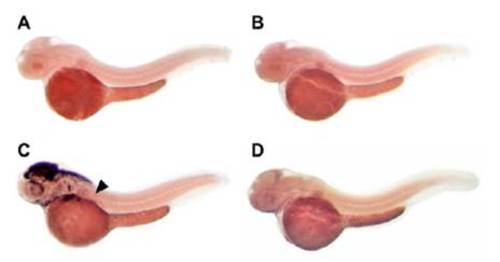
In situ hybridization on day 2 zebrafish embryos. (A) fto sense control and (B) fto antisense probe: fto is not significantly expressed at this stage of embryogenesis. (C) irx3a; arrowhead points to endodermal expression. (D) cdkal1 is expressed ubiquitously at a low level. |
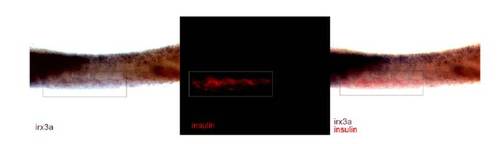
irx3a expression in the pancreatic islet during late somitogenesis (20-somite stage). irx3a digoxigenin labeled riboprobes colocalize with insulin expressing cells marked by fluorescently tagged antisense riboprobes (outlined by the rectangle). Lateral view, with anterior to the left. EXPRESSION / LABELING:
|

Exon 2 skipping shown by the RT-PCR amplification of a 266-bp amplicon and absence of the 1,296 band (lane 8). Lanes 1 and 10, molecular weight marker; lanes 2 and 6, negative control (mock); lanes 3–5, exon 1 amplification (positive control); lanes 7–9, exon 1–3 amplifications; lane 7, 0.5 g/L MO2-irx3a– injected embryos; lane 8, 1 g/L MO2-irx3a–injected embryos; lane 9, uninjected embryos. |
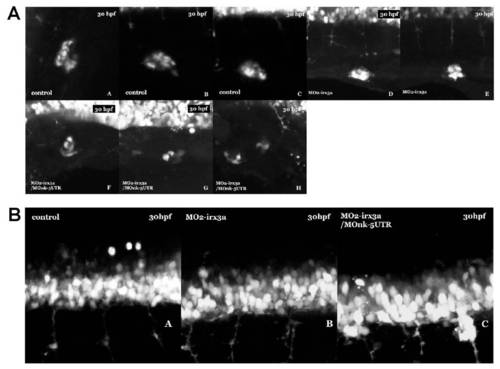
(A) irx3a and nkx2.2a knockdown severely perturb hlxb9 expression in pancreatic endocrine cells. Representative confocal projections of 30 hpf hlxb9: GFP larvae injected with control morpholino (A–C), irx3a morpholino (D and E), and irx3a/nkx2.2a morpholinos (F, G, and H). (B) irx3a and nkx2.2a knockdown increases hb9 expression in spinal cord motor neurons (MNs). Representative confocal projections of 30 hpf hb9:GFP larvae injected with control morpholino (A), irx3a morpholino (B), and irx3a/nkx2.2a morpholinos (C). EXPRESSION / LABELING:
|