|
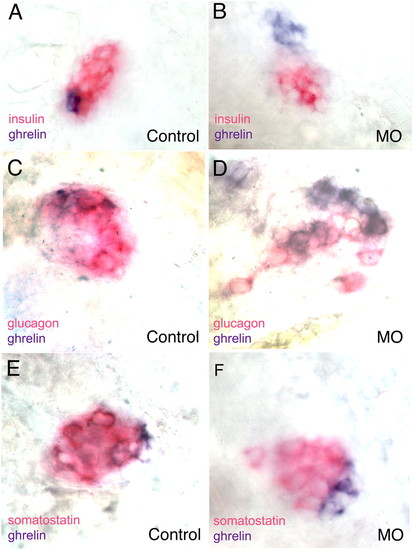
Pancreatic buds of 48-hpf zebrafish embryos showing a reduction in the number of insulin-expressing cells and an increase of ghrelin-expressing cells in irx3a morphants. In situ hybridization with insulin (red) and ghrelin (blue) probes on control (A) and irx3a morphant embryos (B). Statistical support for the observation is given in Table 3. (C and D) irx3a morphants display a reduction in pancreatic α-cells. In situ hybridization with glucagon (red in C and D), somatostatin (red in E and F), and ghrelin (blue in C–F) probes on control (C and E) and irx3a morphant embryos (D and F). showing reduction in the number of α-cells (D) and increase of ghrelin-expressing cells (D and F) in the pancreatic bud of 48-hpf irx3a morphant embryos. The number of δ-cells is unaffected. Embryos are in ventral view. Statistical support for the observation is given in Table 4.
|