
|
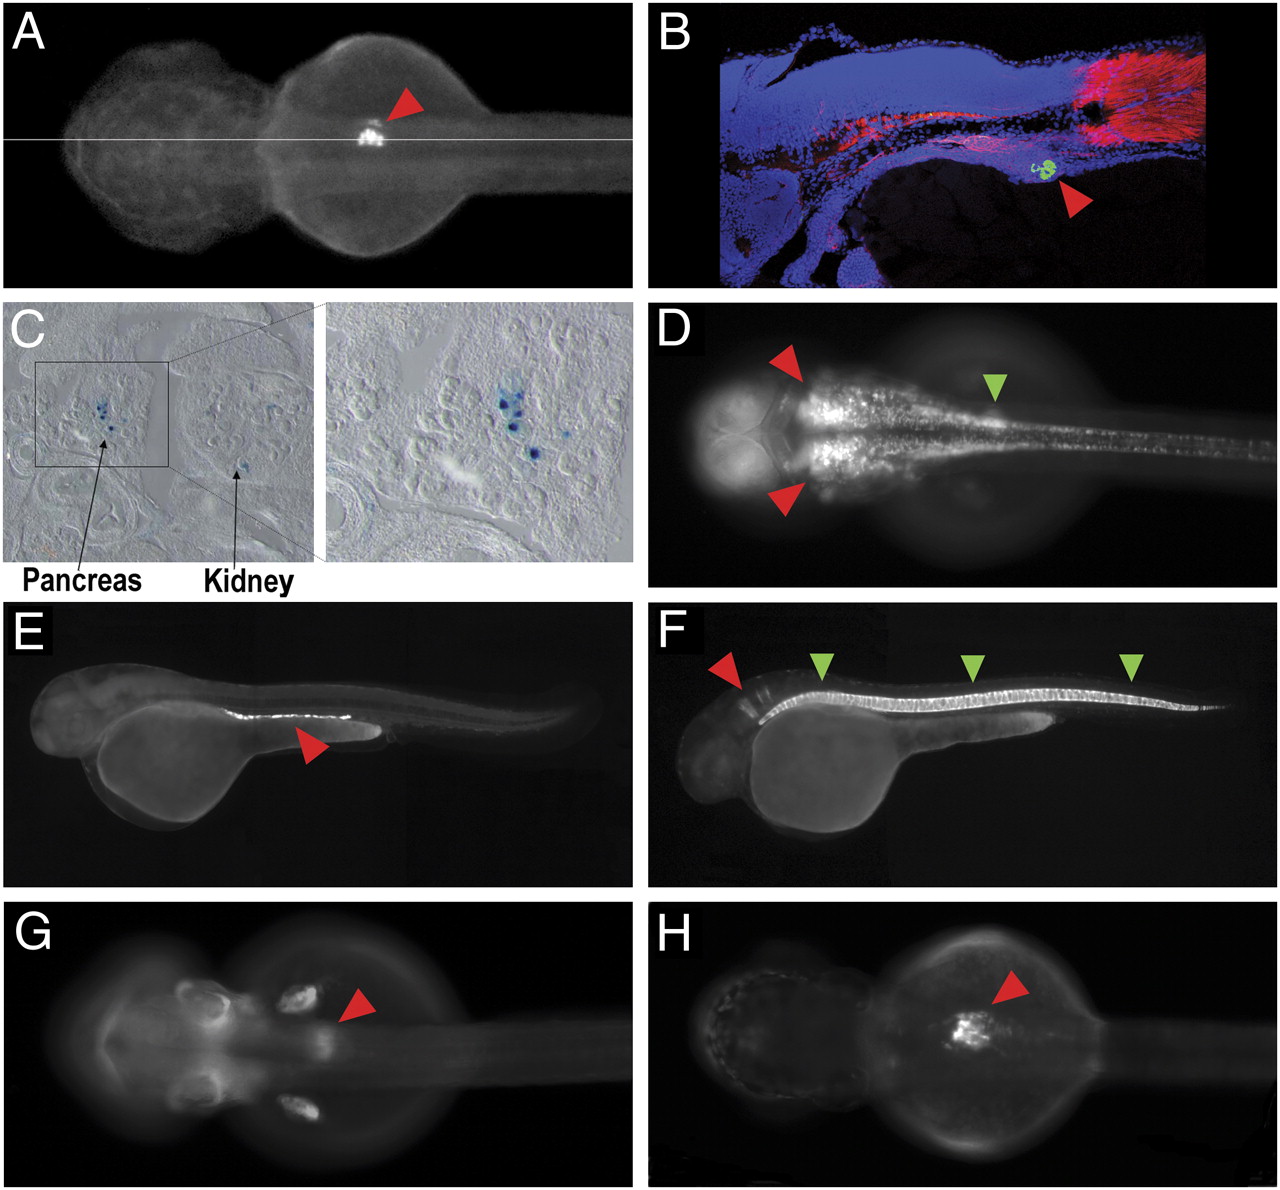
Fig. 2 Reporter expression patterns directed by noncoding elements from T2D risk regions. (A and B) Live dorsal image (A) and cryosection (B) of a 72-hpf transgenic zebrafish showing GFP-reporter expression driven by the Xenopus element equivalent to the rs1111875-containing human HCNE downstream of HHEX (element 1). Red arrowheads point to the pancreatic anlagen. The horizontal line in (A) shows the level of section in B. The cryosection (B) was stained for DNA using DAPI (blue), for muscle actin using rhodamine-phalloidin (red) and for GFP using anti-GFP (green). (C) Sections through the pancreas of a 14.5-d mouse transgenic for rs1111875-containing human HCNE downstream of HHEX (element 1). LacZ staining is seen in the pancreatic anlagen. (D) Live dorsal image of a 48-hpf transgenic zebrafish showing GFP-reporter expression driven by the human HCNE closest to rs7754840 in CDKAL1 (element 2). Arrowheads point to expression in the hindbrain (red) and the primordium of the swim bladder (green). (E and F). Live lateral images of 48-hpf transgenic zebrafish showing GFP-reporter expression driven by the most deeply conserved HCNEs in the obesity-associated LD block of FTO. Element 3 (E) drives expression in the pronephric duct (red arrowhead), whereas element 4 (F) drives expression in the notochord (green arrowheads) and in hindbrain rhombomeres (red arrowhead). (G and H) Live dorsal images of 48-hpf transgenic zebrafish showing GFP-reporter expression driven by the rs1421085-containing HCNE and the rs9939609- containing HCNE in the FTO intron 1. Red arrowheads point to expression in the pancreatic area.