
Image
|
Figure Caption
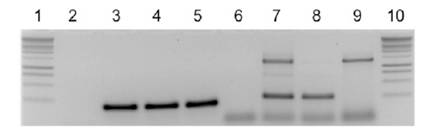
Fig. S3 Exon 2 skipping shown by the RT-PCR amplification of a 266-bp amplicon and absence of the 1,296 band (lane 8). Lanes 1 and 10, molecular weight marker; lanes 2 and 6, negative control (mock); lanes 3–5, exon 1 amplification (positive control); lanes 7–9, exon 1–3 amplifications; lane 7, 0.5 g/L MO2-irx3a– injected embryos; lane 8, 1 g/L MO2-irx3a–injected embryos; lane 9, uninjected embryos.
Acknowledgments
This image is the copyrighted work of the attributed author or publisher, and
ZFIN has permission only to display this image to its users.
Additional permissions should be obtained from the applicable author or publisher of the image.
Full text @ Proc. Natl. Acad. Sci. USA