
- Title
-
Disc1 regulates foxd3 and sox10 expression, affecting neural crest migration and differentiation
- Authors
- Drerup, C.M., Wiora, H.M., Topczewski, J., and Morris, J.A.
- Source
- Full text @ Development
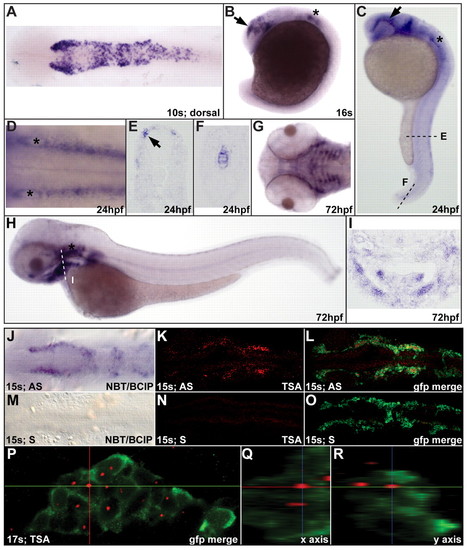
disc1 expression in zebrafish CNC. (A) Dorsal view of a 10s (14 hpf) embryo showing disc1 expression in the CNC. (B,C) Lateral views with anterior to the left show continued disc1 expression in CNC migrating around the eye (arrow) and the developing ear (*) at 16s and 24 hpf. (D) Dorsal view of the hindbrain at 24 hpf shows disc1 expression in the neural crest on either side of the neural tube. (E,F) Sections through the trunk (E) and tail (F) show disc1 expression in trunk neural crest and notochord at 24 hpf. (G-I) Ventral and lateral views show disc1 expression in the developing craniofacial skeleton at 72 hpf. This was corroborated by a coronal section through this region (I). (J-L) Fluorescent in situ hybridization for disc1 replicated the staining pattern observed using standard, chromatogenic methods (J) at 15s. (K,L) disc1 in situ hybridization in Tg(sox10:egfp) zebrafish illustrated specific expression in EGFP-positive CNC cells. (M-O) Sense probes showed no specific staining. (P-R) Orthogonal views of the third stream of migrating CNC at 17s confirmed disc1 expression. AS, antisense probe; S, sense probe; NBT/BCIP, Nitro blue tetrazolium chloride/5-Bromo-4-chloro-3-indolyl phosphate, toluidine salt; TSA, Tyramide Signal Amplification. Dorsal views with anterior to the left. EXPRESSION / LABELING:
|
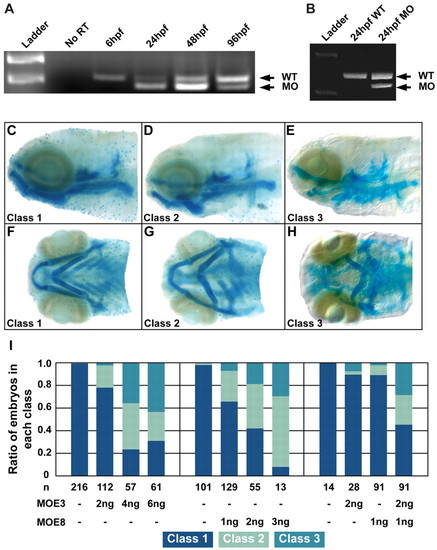
Two splice-site targeted Disc1 morpholinos altered disc1 transcript size and craniofacial development. (A) RT-PCR analysis of MOE3-injected embryos demonstrated alternative splicing of disc1 pre-mRNA resulting in a smaller transcript. At 6 hpf, maternally expressed disc1 could not be modified by the splice site-targeted morpholino, which resulted in the wild-type transcript present. (B) MOE8 injection also effectively altered transcript size. (C-H) Morpholino-mediated Disc1 knockdown resulted in three classes of craniofacial cartilage defects. (C,F) Class 1 (normal); (D,G) class 2; (E,H) class 3. (C-E) Lateral views; (F-H) ventral views with anterior to the left. (I) The ratio of MOE3 and MOE8 morphant embryos in each class was dose dependent. (I, right) Although half-effective doses of MOE3 or MOE8 did not affect craniofacial development, they acted synergistically to produce a high ratio of larvae with abnormal craniofacial cartilage. PHENOTYPE:
|
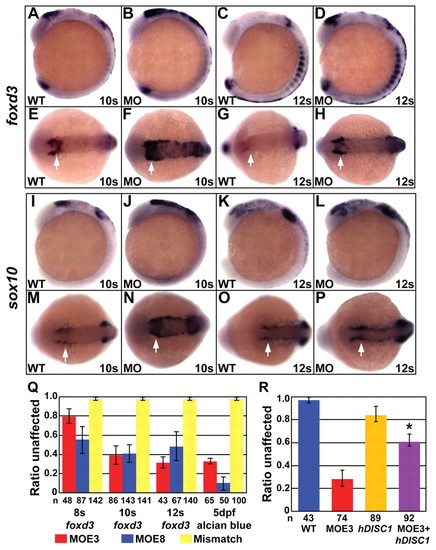
Disc1 morphants had a medial expansion of foxd3 and sox10 expression. (A-H) At 10s and 12s, lateral (A-D) and dorsal (E-H) views show the medial expansion and increased level of foxd3 expression in Disc1 morphants (arrows). (I-P) sox10 expression showed similar results. (Q) foxd3 in situ hybridization and Alcian Blue staining of craniofacial cartilage was done on Disc1 morphants and mismatch control-injected embryos from within the same clutch. The ratio of embryos with normal foxd3 expression was significantly reduced in embryos injected with either MOE3 or MOE8. The ratio of larvae from the same clutches with normal Alcian Blue staining (class 1) was similarly reduced. Injection of a mismatch control produced no defect in foxd3 expression or cartilage development. (R) The medial expansion of foxd3 expression can be rescued in Disc1 morphants by co-injection of 100 pg of human DISC1 mRNA (*, P<0.01). EXPRESSION / LABELING:
PHENOTYPE:
|
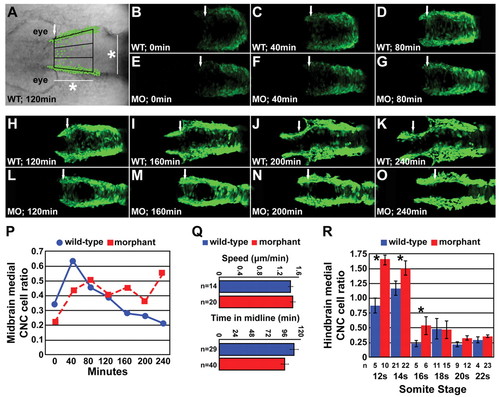
Time-lapse imaging of medial CNC cell movement. (A) Time-lapse, live embryo imaging in Disc1 morphant and control Tg(sox10:egfp) zebrafish was performed to analyze the movement of CNC cells in the area depicted, dorsal to the developing midbrain (white arrow, anterior border; *, the width of the neural rod at 10s, see Materials and methods for details). (B-O) Representative images from the time-lapse of Disc1 morphants and controls at seven evenly spaced time-points (from minute 0 to 240) starting at 6s. The posterior border of the developing eye was aligned at each time-point. (P) A high proportion of CNC cells occupy the midline in Disc1 morphants throughout the time-lapse, whereas this phenotype is short lived in controls. (Q) Neither the speed of CNC cell medial migration (top) nor the time spent in the midline (bottom) were altered in Disc1 morphants (n, number of cells). (R) In a separate experiment, we determined that CNC cells in the hindbrain region behaved similarly; the ratio of medially lying CNC dorsal to the hindbrain (arches 2 and 3 in Fig. 5A) was elevated in Disc1 morphants until the 16s stage. *, P<0.05. EXPRESSION / LABELING:
PHENOTYPE:
|
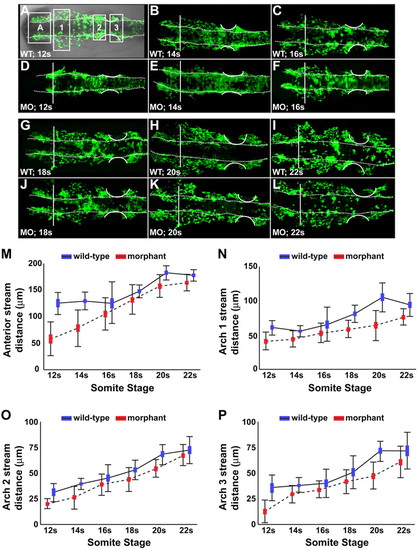
CNC migration from the neural rod was hindered in Disc1 morphants. (A) DIC overlay showing a flat-mounted Tg(sox10:egfp) zebrafish (dorsal view, anterior to the left), demonstrating the four streams analyzed. (A-L) Flat-mounted control and Disc1 morphant Tg(sox10:egfp) zebrafish (dorsal view, anterior to the left) were fixed at evenly spaced intervals from 12s to 22s. CNC migratory distance was measured in the anterior (A), arch 1 (1), arch 2 (2) and arch 3 (3) streams of the neural crest (as indicated by the boxed regions in A). Vertical line marks the posterior eye; dotted lines outline the neural rod; curved lines outline the developing ear. (M-P) Graphical representation of the maximum migratory distance achieved by neural crest cells in each stream. Disc1 morphant CNC cells are hindered in their migration away from the dorsolateral midbrain and hindbrain. Height of the box is the mean±s.e.m. Error bars represent s.d. EXPRESSION / LABELING:
PHENOTYPE:
|
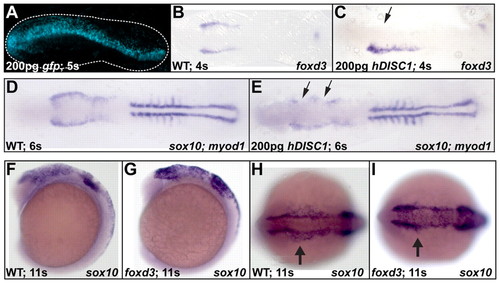
Disc1 repressed foxd3 and sox10 expression. (A) Injection of 200 pg of gfp mRNA into one cell of a two- to four-cell-stage embryo resulted in unilateral expression at 5s. Dotted line outlines the edge of the embryo. (B-E) Asymmetrical overexpression of the human ortholog of disc1 resulted in a unilateral loss of foxd3 (B,C) and sox10 (D,E) expression (arrows). Expression of myod1 was normal. Dorsal views with anterior to the left. (F-I) Overexpression of Foxd3 resulted in an expansion of sox10 expression (arrows in H,I) similar to that seen in Disc1 morphants. F and G are lateral views, H and I, dorsal views, both with anterior to the left. |
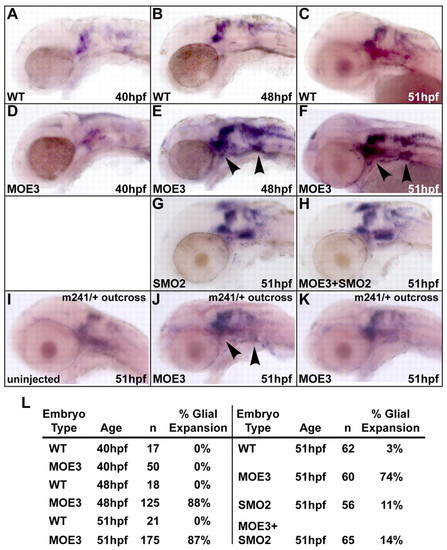
Peripheral cranial glia populations were expanded in Disc1 morphants. (A-F) foxd3 expression, which marks the developing glia, was expanded at 48 hpf and 51 hpf, but not 40 hpf, in Disc1 morphants (arrowheads indicate enhanced expression in the trigeminal ganglion and the posterior lateral line ganglion). (G,H) Glial expansion was suppressed by SMO2 co-injection. (I-K) Glial expansion was also suppressed in 49% of Disc1 morphants from a sox10m241/+ by wild-type cross. Uninjected embryos (I; n=47) showed normal foxd3 expression, whereas Disc1 morphants (n=144) showed two distinct phenotypes, expanded (J, arrowheads) and normal (K) foxd3 expression, which probably correlates to their genotype (wild-type or heterozygous). (L) Table showing the percentage of Disc1 morphants with glial expansion (left) and suppression of expansion by SMO2 co-injection (right). |
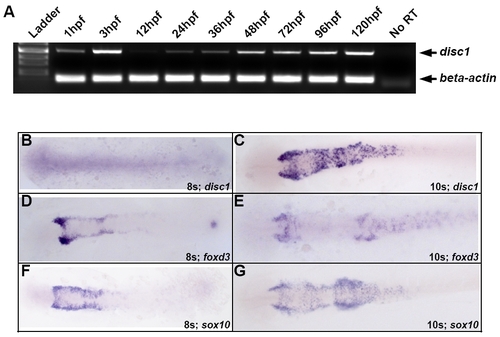
disc1 expression in the developing zebrafish embryo. (A) Semi-quantitative RT-PCR analysis of disc1 expression in the developing zebrafish embryo and larva demonstrated maternal expression at 1 hpf but downregulation of the transcript by 12 hpf. disc1 expression then gradually increased through 120 hpf. Levels were compared with an actin internal control. (B-G) disc1 expression likely overlaps with foxd3 and sox10 at 10s. Dorsal views of in situ hybridizations with anterior to the left illustrated that disc1 is not expressed at 8s but is expressed in at least a subset of foxd3- and |
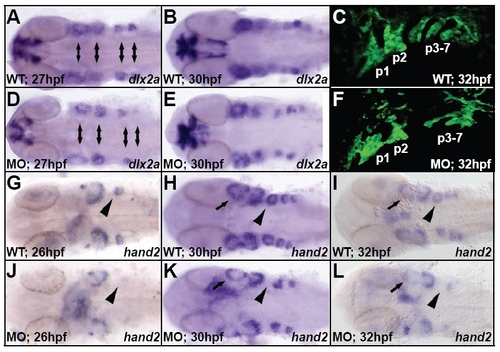
Pharyngeal arch CNC populations were reduced in Disc1 morphants. (A,B,D,E) dlx2a expression, marking the neural crest population in these structures, is reduced in the pharyngeal arches of Disc1 morphants (double-headed arrows). (G-L) Similarly, hand2 expression was dramatically reduced or lost in the pharyngeal arches at 26 hpf, 30 hpf, and 32 hpf in Disc1 morphants (arrow marks first arch; arrowhead marks posterior arches). (C,F) Pharyngeal arch (P1-P7) development was also reduced at 32 hpf in Tg(sox10:egfp) zebrafish. All views are dorsal with anterior to the left, except for C and F, which are lateral views. |
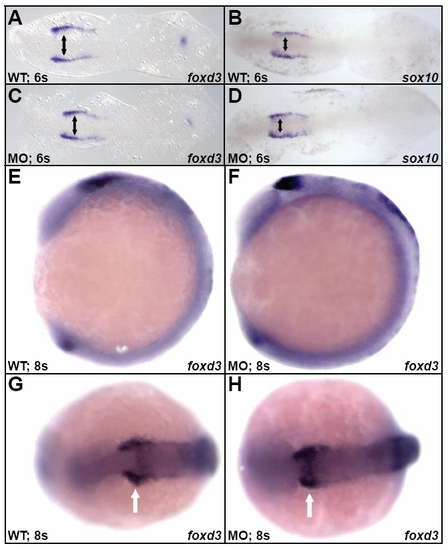
Disc1 morphant CNC cells were induced normally. (A-D) At 6s, expression of foxd3 and sox10 were normal in Disc1 morphants. (E-H) Similarly, lateral (E,F) and dorsal (G,H) views of wild-type and Disc1 morphant embryos demonstrated identical expression of foxd3 at 8s. Anterior is to the left in all images. Arrows mark foxd3 expression in CNC cells of wild-type and Disc1 morphant embryos. |
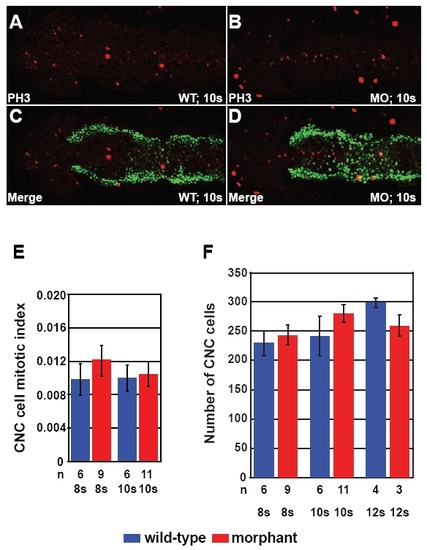
Expansion of foxd3 and sox10 expression was not due to increased CNC proliferation. (A-D) Phosphohistone H3 immunohistochemical staining was done in Disc1 morphant and control Tg(sox10:egfp) zebrafish at 8s (not shown) and 10s (A-D). The proportion of CNC cells undergoing cell division was determined in the area dorsal to the developing neural rod between the posterior eyes and the anterior ear. (E) There was no difference in mitotic index ratio of phosphohistone H3-positive CNC cells (yellow) to total CNC cells (green and yellow) between control and Disc1 morphant siblings. All views are dorsal with anterior to the left. (F) In addition, total CNC cell number was not altered in Disc1 morphants, indicating no change in the size of the CNC population in this region. |
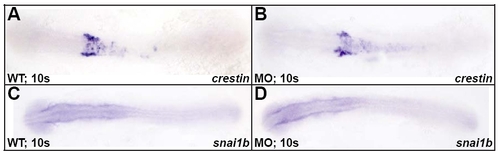
crestin and snai1b were expressed normally in Disc1 morphants. (A,B) Dorsal views of wild-type and Disc1 morphant embryos subjected to in situ hybridization for crestin demonstrate normal expression of this marker at 10s. (C,D) Similarly, expression of snai1b, another CNC marker, was normal in Disc1 morphants at 10s. Anterior is to the left. |
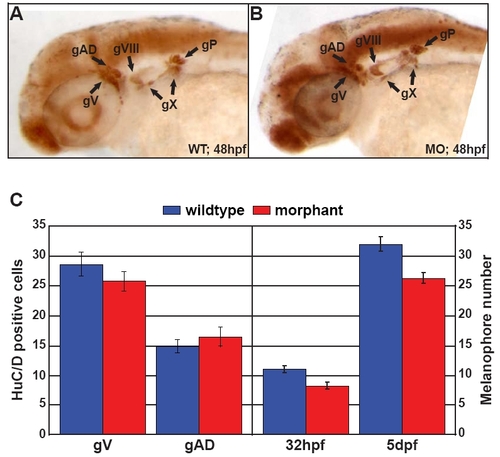
Disc1 morphants had normal peripheral neuronal development but slightly delayed pigmentation. (A,B) HuC/D immunohistochemistry at 48 hpf in wild type and Disc1 morphants demonstrated identical staining, indicating that Disc1 knockdown does not affect peripheral neuronal development. Lateral views with anterior to the left. (C) There is no difference in HuC/D-positive cell number between wild-type and Disc1 morphant zebrafish in the trigeminal ganglion (gV), which is partially CNC derived. For comparison, the number of HuC/D-positive cells in the anterior lateral line ganglion (gAD), which is derived from placodal tissue, was also counted. In addition, the melanocyte population in the head (anterior to the midbrain-hindbrain boundary) was slightly developmentally delayed in Disc1 morphants but remained comparable to that of wild-type counterparts. |