
Fig. S4
- ID
- ZDB-FIG-090804-53
- Publication
- Drerup et al., 2009 - Disc1 regulates foxd3 and sox10 expression, affecting neural crest migration and differentiation
- Other Figures
- All Figure Page
- Back to All Figure Page
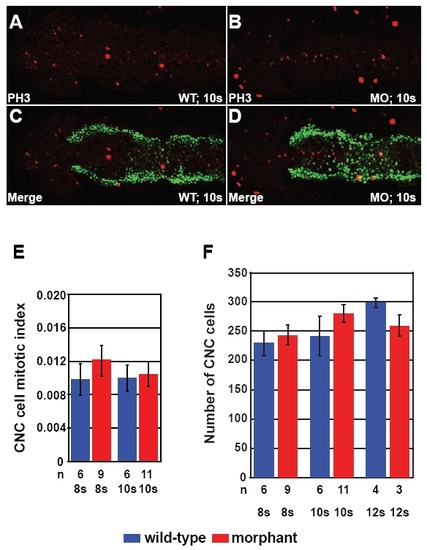
Expansion of foxd3 and sox10 expression was not due to increased CNC proliferation. (A-D) Phosphohistone H3 immunohistochemical staining was done in Disc1 morphant and control Tg(sox10:egfp) zebrafish at 8s (not shown) and 10s (A-D). The proportion of CNC cells undergoing cell division was determined in the area dorsal to the developing neural rod between the posterior eyes and the anterior ear. (E) There was no difference in mitotic index ratio of phosphohistone H3-positive CNC cells (yellow) to total CNC cells (green and yellow) between control and Disc1 morphant siblings. All views are dorsal with anterior to the left. (F) In addition, total CNC cell number was not altered in Disc1 morphants, indicating no change in the size of the CNC population in this region. |