|
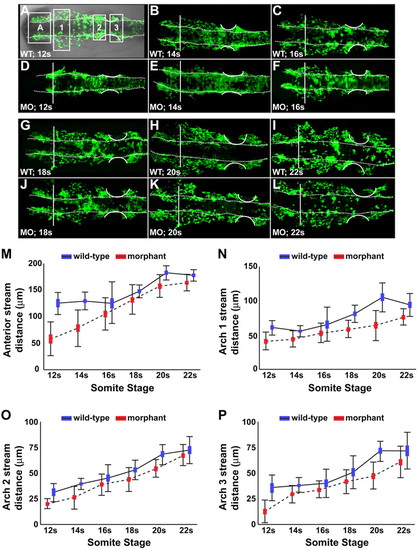
CNC migration from the neural rod was hindered in Disc1 morphants. (A) DIC overlay showing a flat-mounted Tg(sox10:egfp) zebrafish (dorsal view, anterior to the left), demonstrating the four streams analyzed. (A-L) Flat-mounted control and Disc1 morphant Tg(sox10:egfp) zebrafish (dorsal view, anterior to the left) were fixed at evenly spaced intervals from 12s to 22s. CNC migratory distance was measured in the anterior (A), arch 1 (1), arch 2 (2) and arch 3 (3) streams of the neural crest (as indicated by the boxed regions in A). Vertical line marks the posterior eye; dotted lines outline the neural rod; curved lines outline the developing ear. (M-P) Graphical representation of the maximum migratory distance achieved by neural crest cells in each stream. Disc1 morphant CNC cells are hindered in their migration away from the dorsolateral midbrain and hindbrain. Height of the box is the mean±s.e.m. Error bars represent s.d.
|