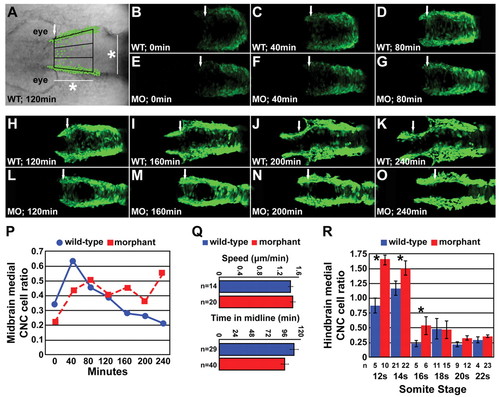
Time-lapse imaging of medial CNC cell movement. (A) Time-lapse, live embryo imaging in Disc1 morphant and control Tg(sox10:egfp) zebrafish was performed to analyze the movement of CNC cells in the area depicted, dorsal to the developing midbrain (white arrow, anterior border; *, the width of the neural rod at 10s, see Materials and methods for details). (B-O) Representative images from the time-lapse of Disc1 morphants and controls at seven evenly spaced time-points (from minute 0 to 240) starting at 6s. The posterior border of the developing eye was aligned at each time-point. (P) A high proportion of CNC cells occupy the midline in Disc1 morphants throughout the time-lapse, whereas this phenotype is short lived in controls. (Q) Neither the speed of CNC cell medial migration (top) nor the time spent in the midline (bottom) were altered in Disc1 morphants (n, number of cells). (R) In a separate experiment, we determined that CNC cells in the hindbrain region behaved similarly; the ratio of medially lying CNC dorsal to the hindbrain (arches 2 and 3 in Fig. 5A) was elevated in Disc1 morphants until the 16s stage. *, P<0.05.
|
