|
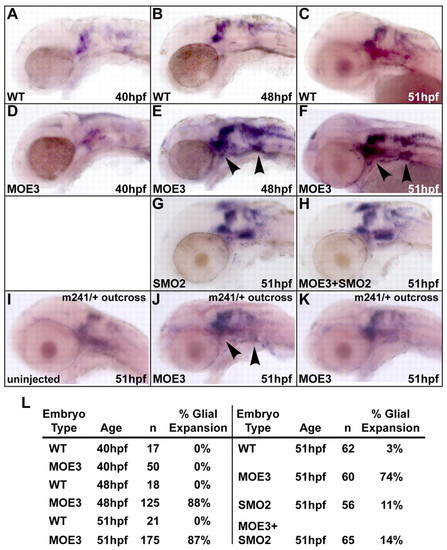
Peripheral cranial glia populations were expanded in Disc1 morphants. (A-F) foxd3 expression, which marks the developing glia, was expanded at 48 hpf and 51 hpf, but not 40 hpf, in Disc1 morphants (arrowheads indicate enhanced expression in the trigeminal ganglion and the posterior lateral line ganglion). (G,H) Glial expansion was suppressed by SMO2 co-injection. (I-K) Glial expansion was also suppressed in 49% of Disc1 morphants from a sox10m241/+ by wild-type cross. Uninjected embryos (I; n=47) showed normal foxd3 expression, whereas Disc1 morphants (n=144) showed two distinct phenotypes, expanded (J, arrowheads) and normal (K) foxd3 expression, which probably correlates to their genotype (wild-type or heterozygous). (L) Table showing the percentage of Disc1 morphants with glial expansion (left) and suppression of expansion by SMO2 co-injection (right).
|