
IMAGE
Fig. S1
- ID
- ZDB-IMAGE-090804-53
- Publication
- Drerup et al., 2009 - Disc1 regulates foxd3 and sox10 expression, affecting neural crest migration and differentiation
- All Figures
- Figures for Drerup et al., 2009
Image
|
Figure Caption
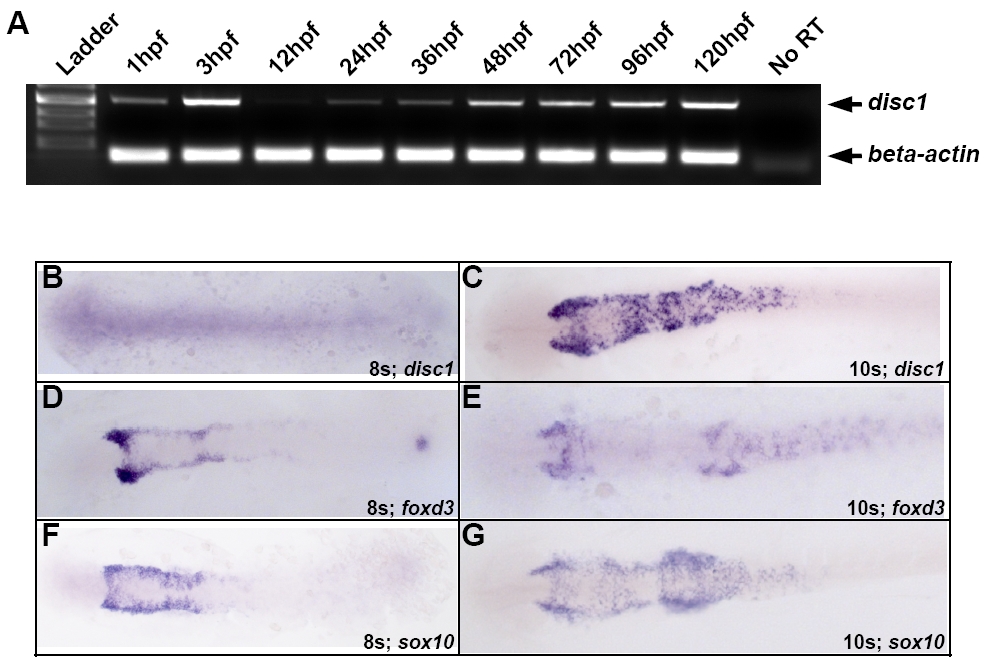
Fig. S1 disc1 expression in the developing zebrafish embryo. (A) Semi-quantitative RT-PCR analysis of disc1 expression in the developing zebrafish embryo and larva demonstrated maternal expression at 1 hpf but downregulation of the transcript by 12 hpf. disc1 expression then gradually increased through 120 hpf. Levels were compared with an actin internal control. (B-G) disc1 expression likely overlaps with foxd3 and sox10 at 10s. Dorsal views of in situ hybridizations with anterior to the left illustrated that disc1 is not expressed at 8s but is expressed in at least a subset of foxd3- and
Acknowledgments
This image is the copyrighted work of the attributed author or publisher, and
ZFIN has permission only to display this image to its users.
Additional permissions should be obtained from the applicable author or publisher of the image.
Full text @ Development