
Fig. 1
- ID
- ZDB-IMAGE-090804-46
- Genes
- Publication
- Drerup et al., 2009 - Disc1 regulates foxd3 and sox10 expression, affecting neural crest migration and differentiation
- All Figures
- Figures for Drerup et al., 2009
|
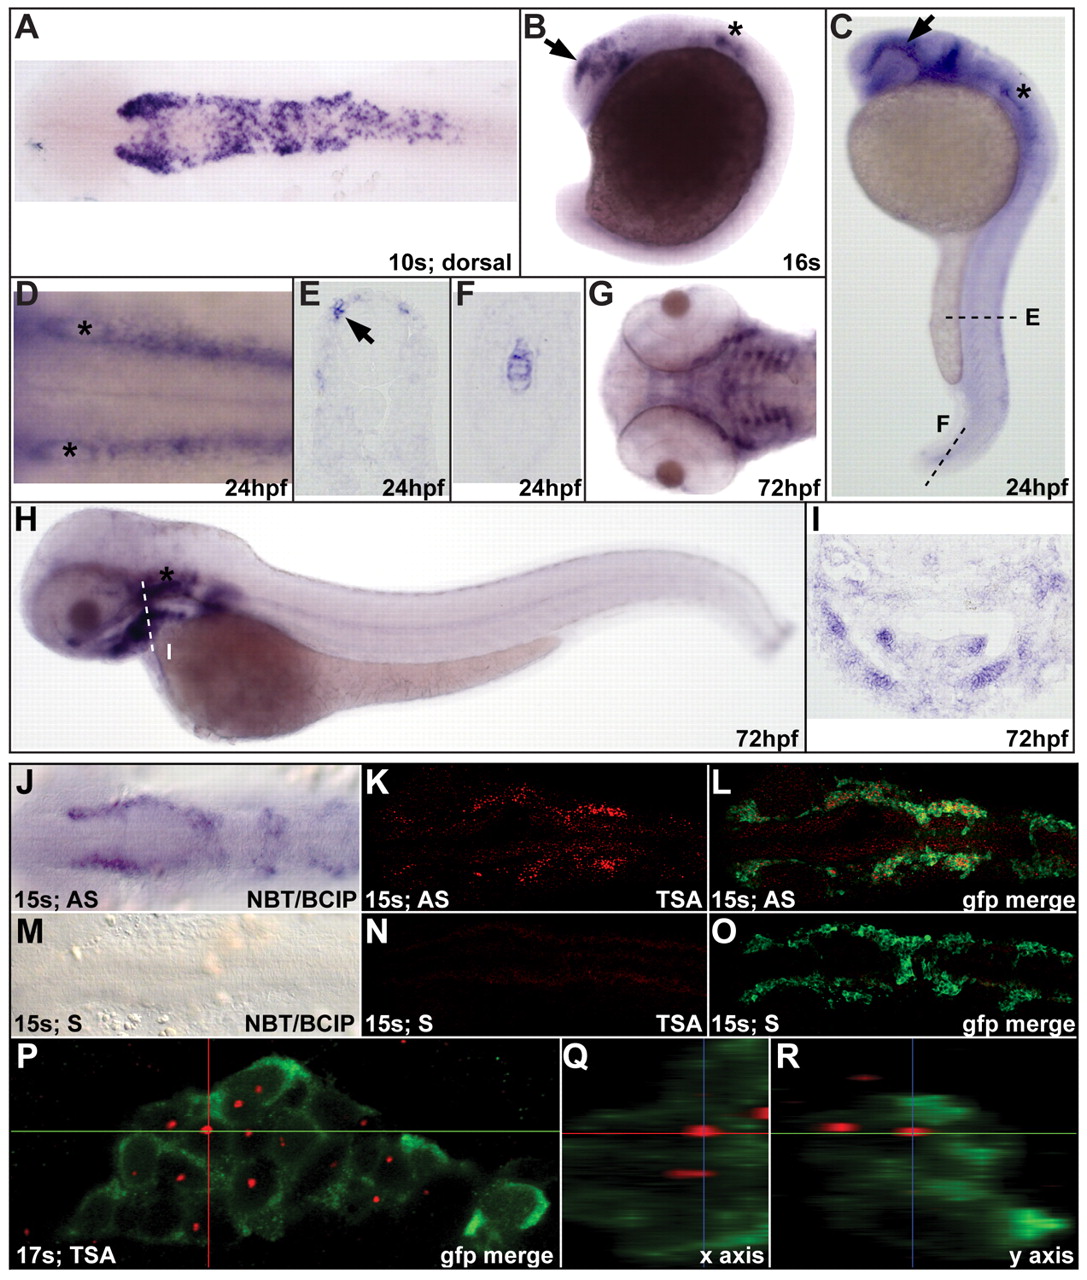
Fig. 1 disc1 expression in zebrafish CNC. (A) Dorsal view of a 10s (14 hpf) embryo showing disc1 expression in the CNC. (B,C) Lateral views with anterior to the left show continued disc1 expression in CNC migrating around the eye (arrow) and the developing ear (*) at 16s and 24 hpf. (D) Dorsal view of the hindbrain at 24 hpf shows disc1 expression in the neural crest on either side of the neural tube. (E,F) Sections through the trunk (E) and tail (F) show disc1 expression in trunk neural crest and notochord at 24 hpf. (G-I) Ventral and lateral views show disc1 expression in the developing craniofacial skeleton at 72 hpf. This was corroborated by a coronal section through this region (I). (J-L) Fluorescent in situ hybridization for disc1 replicated the staining pattern observed using standard, chromatogenic methods (J) at 15s. (K,L) disc1 in situ hybridization in Tg(sox10:egfp) zebrafish illustrated specific expression in EGFP-positive CNC cells. (M-O) Sense probes showed no specific staining. (P-R) Orthogonal views of the third stream of migrating CNC at 17s confirmed disc1 expression. AS, antisense probe; S, sense probe; NBT/BCIP, Nitro blue tetrazolium chloride/5-Bromo-4-chloro-3-indolyl phosphate, toluidine salt; TSA, Tyramide Signal Amplification. Dorsal views with anterior to the left.