
- Title
-
Anatomy of zebrafish cerebellum and screen for mutations affecting its development
- Authors
- Bae, Y.K., Kani, S., Shimizu, T., Tanabe, K., Nojima, H., Kimura, Y., Higashijima, S.I., and Hibi, M.
- Source
- Full text @ Dev. Biol.
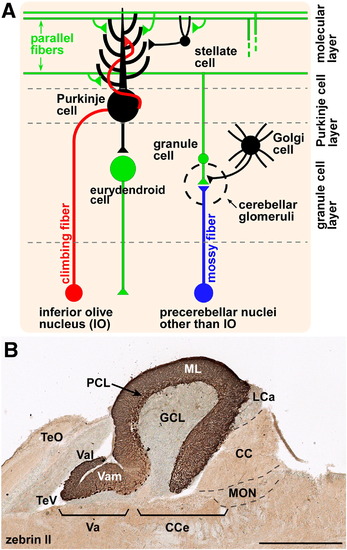
Cerebellar neurons and circuits. (A) Schematic presentation of zebrafish cerebellar neurons and circuits. (B) Zebrin II immunohistochemistry of a sagittal section of adult cerebellum. DAB staining. Anterior is to the left. CC, crista cerebellaris; CCe, corpus cerebelli; GCL, granule cell layer; LCa, lobus caudalis cerebelli; ML, molecular layer; MON, medial octavolateralis nucleus; PCL, Purkinje cell layer; TeO, tectum opticum; TeV, tectal ventricle; Va, valvula cerebelli; Vam, medial division of valvula cerebelli; Val, lateral division of the valvula cerebelli. Scale bars: 500 μm (B). |
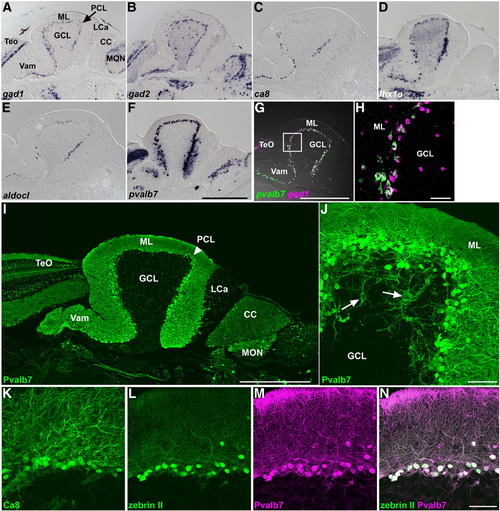
GABAergic neurons. (A–F) Expression of gad1 (A), gad2 (B), carbonic anhydrase 8 (ca8, C), lhx1a (lim1, D), aldolase c-like (aldocl, E), and parvalbumin7 (pvalb7, F) in the adult cerebellum. In situ hybridization of sagittal sections. Anterior is to the left. (G, H) Comparison of pvalb7 (green) and gad1 (magenta) expression. (H) High-magnification view of the box in G. Note that all the pvalb7+ cells are gad1+ (white), but there are gad1+ pvalb7- cells (magenta) in the GCL and ML. (I, J) Fluorescence immunohistochemistry of adult cerebellum with an anti-parvalbumin7 antibody (Pvalb7). Low (I) and high (J) magnification views. The position of the PCL is indicated by an arrowhead (I). Axons of Purkinje cells are indicated by arrows (J). Pvalb7+ axons reach and surround Pvalb7- cells (indicated by arrows), which correspond to eurydendroid cells (J). (K–N) Anti-carbonic anhydrase 8 (Ca8, K), zebrin II (L) and anti-parvalbumin7 (Pvalb7, M) antibody staining. Zebrin II (green) and Pvalb7 (magenta) staining completely overlap (N). The abbreviations are described in Fig. 1. Scale bars: 500 μm (F, G, I) and 50 μm (H, J, N). |
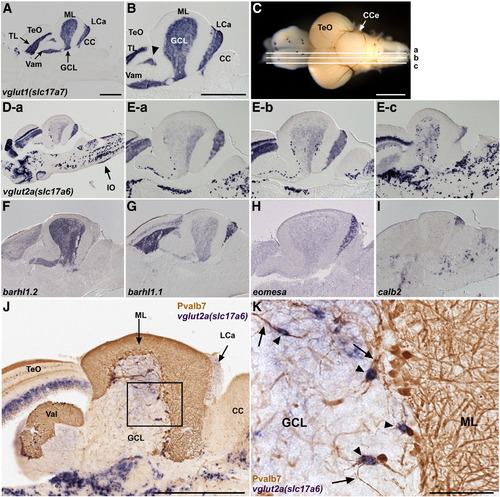
Glutamatergic neurons. (A, B) Expression of vglut1 (slc17a7) in the adult cerebellum. In situ hybridization of a sagittal section. Low (A) and high (B) magnification views. Anterior is to the left. vglut1 expression is detected in the torus longitudinalis (TL) of the TeO and the GCL of the Va, CCe, and LCa. The vglut1+ region between TeO and GCL (indicated by arrowhead) belongs to the GCL (Suppl. Fig. 1). (C, D, E) Expression of vglut2a (slc17a6). Sagittal sections at the levels (a medial, b mediolateral, c lateral.) shown in (C) were stained with a vglut2a (slc17a6) riboprobe. Low (D-a) and high (E-a, E-b, E-c) magnification views. vglut2ahigh cells were scarcely observed in the medial region (D-a), but many were detected in more lateral regions (E-b, E-c). Expression of vglut2a (slc17a6) in the inferior olive nucleus is marked by an arrow (D-a). (F–I) Differential expression of barhl1.2 (F), barhl1.1 (G), eomesodermin a (eomesa, H), and calbindin2 (calb2, I). (J, K) vglut2ahigh eurydendroid cells. Co-staining with a vglut2a riboprobe (purple, NBT/BCIP staining) and anti-Pvalb7 antibody (brown, DAB staining). (K) High-magnification view of the box in J. Note that vglut2ahigh cells (arrowheads) receive inputs from the Pvalb7+ axons of Purkinje cells (arrows). The abbreviations are described in Fig. 1. Scale bars: 500 μm (A, B, C, J) and 100 μm (K). The magnification of D and E–I are the same as in A and B, respectively. EXPRESSION / LABELING:
|
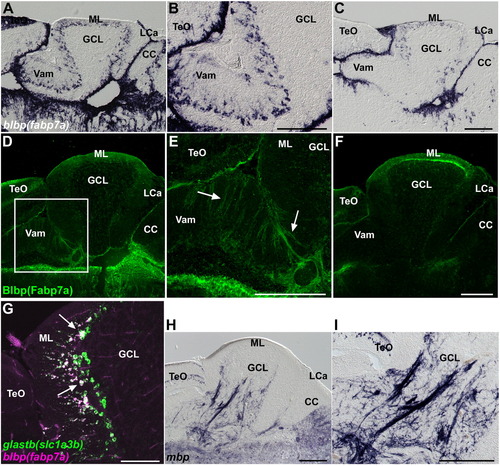
Bergmann glia, and oligodendrocytes, and olig2+ cells. (A–C) Expression of blbp (fabp7a). Sagittal sections of the medial (A, B) and lateral (C) regions of the adult cerebellum. Low (A, C) and high (B) magnification views. (D–F) Immunostaining of Blbp (Fabp7a). Sagittal sections of the medial (D, E) and lateral (F) regions of the cerebellum. Low (D, F) and high (E) magnification views. The palisade structure of the Bergmann glial cells is indicated by arrows. Note that blbp is expressed strongly in the medial region, but it is relatively weak in the lateral regions of Va and, anterior and posterior CCe. Blbp was detected in the Va and dorsal CCe (both medial and lateral regions). (G) Expression of glastb (slc1a3b) and blbp (fabp7a) in adult cerebellum. Note that most of fabp7a-expressing Bergmann glial cells express glastb (indicated by white arrows). (H, I) Expression of myelin basic protein (mbp). Low (H) and high (I) magnification views. The abbreviations are described in Fig. 1. Scale bars: 200 μm (C, E, F, H, I) and 100 μm (G). EXPRESSION / LABELING:
|

olig2+ cells. (A) Expression of olig2 in the adult cerebellum. A sagittal section. (B, C) Co-staining of a Tg(olig2:EGFP) brain with anti-Pvalb7 (magenta) and anti-EGFP (green) antibodies. Low (B) and high (C) magnification views. Note that the EGFP signals never overlap with Pvalb7. The ventricular zone (VZ) is indicated by a dotted line (B). (D–F) Co-staining of the Tg(olig2:EGFP) brain with anti-EGFP antibodies (green), and anti-Sox10 (D), anti-HuC/D (E), or anti-Mbp (F, magenta). Sagittal sections and in the posterior CCe (D), and anterior CCe (E) and GCL (F). Note that olig2:EGFP+ cells that have a small size were stained with anti-Sox10 antibody (arrowheads in D); those having a large cell size were stained with anti-HuC/D antibody (arrowheads in E). olig2:EGFP+ cellular processes do not overlap with Mbp+ oligodendrocytic processes, but rather are adjacent to them (arrowheads in F). (G) BrdU incorporation. Adult Tg(olig2:EGFP) fish were labeled with bromodeoxyuridine (BrdU) for 1 h, and the proliferating cells were analyzed by immunostaining with anti-BrdU (magenta) and anti-EGFP antibodies (green). A sagittal section. The VZ is indicated a dotted line. Note that some of olig2:EGFP+ cells incorporated BrdU (arrowheads). (H) Co-staining of the Tg(olig2:EGFP) brain with a gad1/gad2 riboprobe (magenta) and anti-EGFP antibody (green). olig2:EGFP signals do not overlap with gad1/2 expression. (I) Co-staining of the Tg(olig2:EGFP) cerebellum with a vglut2a riboprobe (purple, NBT/BCIP staining) and anti-EGFP antibodies (brown, DAB staining). Note that some of the olig2:EGFP+ cells express vglut2a. (J) Co-staining of the Tg(olig2:EGFP) cerebellum with anti-Pvalb7 (magenta) and anti-EGFP (green) antibodies. Note that some of olig2:EGFP+ somata (arrows) receive synaptic inputs from Pvalb7+ axons of Purkinje cells. The olig2:EGFP- eurydendroid cells are marked by asterisks. (K, L) Retrograde labeling of eurydendroid cells. The neural tracer was injected into the pretectal region (asterisk, K) of the Tg(olig2:EGFP) adult fish and the brain was stained with the fluorescent avidin (magenta) and anti-EGFP antibodies. (L) High-magnification view of the box in K. Note that an olig2:EGFP+ cell (arrowhead) incorporated the neural tracer. The abbreviations are described in Fig. 1. Scale bars: 200 μm (A, B, K), 50 μm (D, E, G, I), and 20 μm (C, F, H, J, L). EXPRESSION / LABELING:
|
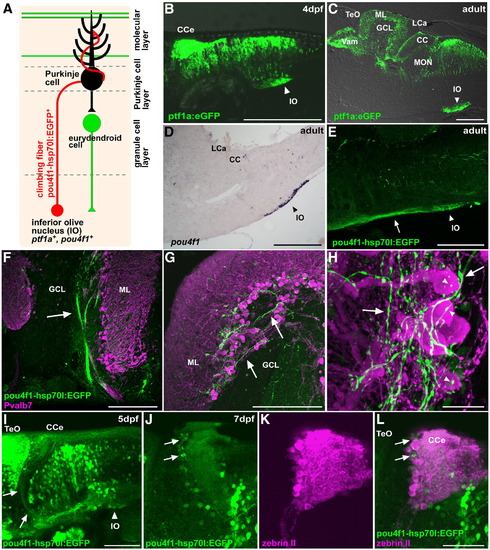
Climbing fibers. (A) Schematic presentation of climbing fibers. (B, C) Detection of EGFP in the inferior olive nucleus in the Tg(ptf1a:eGFP) line at 4 dpf (B) and in the adult (C). Lateral view (B) and sagittal section (C), with anterior to the left. EGFP signals were detected directly with laser scanning microscopy or (B) by immunostaining with an anti-EGFP antibody (C). (D) Expression of pou4f1 (brn3a) in the inferior olive nucleus of the adult hindbrain. In situ hybridization of a sagittal section. (E) Staining of a Tg(pou4f1-hsp70l:EGFP) adult brain with the anti-EGFP antibody. EGFP signals were detected in neurons of the inferior olive nucleus (IO, arrowhead) and in their axons (indicated by an arrow). (F–H) Co-staining of the Tg(pou4f1-hsp70l:EGFP) brain with anti-Pvalb7 (magenta) and anti-EGFP (green) antibodies. Sagittal sections at the lateral (F) and mediolateral levels (G, H). Low (F), middle (G), and high (H) magnification views. The pou4f1-hsp70l:EGFP+ climbing fibers were detected as bundles in the GCL (arrow, F), reached the PCL and ML (arrows, G, H), and synapsed on the soma (marked by arrowhead) and proximal dendrites of Purkinje cells. (I–L) Detection of pou4f1:EGFP+ climbing fibers at larval stages 5 dpf (I) and 7 dpf (J–L). Immunostaining with anti-EGFP antibody (green, I); co-staining with anti-EGFP (green J, L) and zebrin II antibodies (magenta, K, L). Note that pou4f1:EGFP+ climbing fibers from the inferior olive nucleus (IO, arrowhead) were detected at 5 dpf (arrows, I); they innervated to the region containing zebrin II+ Purkinje cell (arrows) at 7 dpf. Lateral views with anterior to the left. Low (I) and high-magnification views (J–L). The abbreviations are described in Fig. 1. Scale bars: 200 μm (B–E), 100 μm (I), 50 μm (L, F, G), and 20 μm (H). |

Mossy fibers and efferent fibers from eurydendroid cells. (A) Schematic presentation of mossy fibers and efferent fibers. (B, C) Co-staining of a Tg(vglut2a:EGFP) brain with zn5 (magenta) and anti-EGFP (green) antibodies. (C) High-magnification view of the box in B. The zn5+ vglut2a:EGFP+ mossy fibers are indicated by an arrow. (D, E) Expression of alcam (zn5). (E) High-magnification view of the box in D. The alcam-expressing cells (marked by an arrow) are located in the vicinity of the trochlear nerve (IV, marked by an arrowhead). (F, G) Co-staining of the Tg(vglut2a:EGFP) brain with anti-calretinin (magenta) and anti-EGFP (green) antibodies. (G) High-magnification view of the box in F. The anti-calretinin antibody stained the soma (arrowheads) and efferent axons (arrow) of eurydendroid cells (vglut2a:EGFP+). (H, I) Co-staining of a Tg(pou4f1-hsp70l:EGFP) brain with anti-calretinin (magenta) and anti-EGFP (green) antibodies. All of the pou4f1-hsp70l:EGFP+ axons were stained with the anti-calretinin antibody (arrowheads, climbing fibers). Calretinin-immunoreactive pou4f1-hsp70l:EGFP- tracts (arrows) are the axons of eurydendroid cells. F/G and H/I show mediolateral and lateral sections, respectively. The abbreviations are described in Fig. 1. Scale bars: 200 μm (B, D, E, F, H, J), 50 μm (G), and 20 μm (C, I). EXPRESSION / LABELING:
|
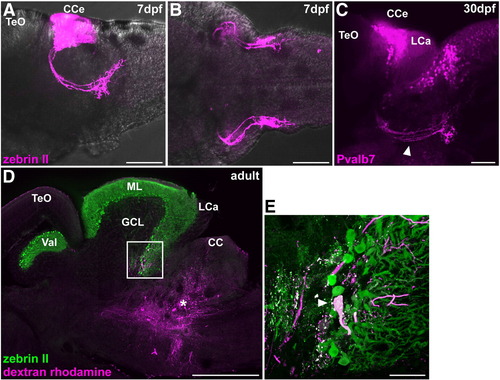
Cerebellovestibular tracts. (A, B) Immunostaining of 7 dpf larval brains with zebrin II. Lateral (A) and ventral (B) views with anterior to the left. (C) Immunostaining of a 30 dpf juvenile fish brain with anti-Pvalb7 antibody. Lateral view with anterior to the left. Cerebellovestibular tracts are indicated by arrowhead. (D, E) Retrograde labeling of cerebellovestibular tracts. A biotin-conjugated neural tracer was injected to the vestibular region (asterisk, D), which includes the descending octaval nucleus, of adult fish. A sagittal section was stained with zebrin II (green) and fluorescently labeled avidin (magenta). (E) High-magnification view of the box in (D). Note that a retrogradely labeled cell is a zebrin II+ Purkinje cell. The abbreviations are described in Fig. 1. Scale bars: 500 μm (D), 100 μm (A–C) and 50 μm (E). |

Presynaptic terminals of mossy and climbing fibers. (A) Immunoblotting of brain lysates with an anti-Vglut2a antibody. Rabbit anti-Vglut2a (lane 1) and pre-immune sera (lane 2) were used to detect Vglut2a (asterisk). Several bands other than 64-kD Vglut2a were detected in lane 1, but they are likely non-specific as they were also detected in lane 2. (B, C) Immunostaining of Vglut2a. Larva at 3 dpf that received 4 pg of antisense vglut2a MO (C) and control larva (B) stained with anti-Vglut2a (green) and anti-HuC/D (magenta) antibodies. Dorsal views of the hindbrain regions. Anti-Vglut2a but not anti-HuC/D staining was abolished in the vglut2a morphant hindbrain. (D–F) Co-staining of a Tg(vglut2a:EGFP) brain with anti-Vglut2a and anti-EGFP antibodies. EGFP (green, D), Vglut2a (magenta, E) and merged images (F) are shown. Sagittal section. Note that Vglut2a+ dots are detected in the distal tips (presynaptic terminals) of vglut2a:EGFP+ axons (mossy fibers) in the GCL. (G, H) Co-staining with anti-Vglut2a (magenta) and anti-Pvalb7 (green) antibodies. Low (G) and high (H) magnification views. Vglut2a+ synaptic boutons were detected on the soma (arrowheads) of Purkinje cells (asterisks) or abutting the proximal dendrites of Purkinje cells (arrow). (I) Co-staining of a Tg(pou4f1-hsp70l:EGFP) brain with anti-Vglut2a (magenta) and anti-EGFP (green) antibodies. Vglut2a+ dots were also pou4f1:EGFP+ in the ML (arrowheads), indicating they were presynaptic terminals of climbing fibers. The position of the PCL is indicated by a dotted line. (J) Immunoblotting of brain lysates with anti-Gad1 antibodies. Rabbit anti-Gad1 generated in this study (lane 1), control sera (pre-immune sera, lane 2), and commercially available anti-human GAD1/2 (lane 3) were used to detect zebrafish Gad1 (asterisk). (K, L) Co-staining of the Tg(vglut2a:EGFP) brain with anti-Gad1(magenta) and anti-EGFP (green) antibodies. Low (K) and high (L, in GCL) magnification views. Vglut2a+ and Gad1+ dots were adjacent in the GCL and indicated the cerebellar glomeruli. The abbreviations are as described in Fig. 1. Scale bars: 100 μm (C, F, G, I, K), 50 μm (L), and 20 μm (H). EXPRESSION / LABELING:
|
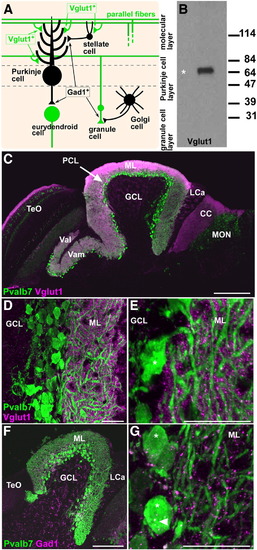
Presynaptic terminals of granule neurons (parallel fibers) and GABAergic interneurons. (A) Schematic presentation. (B) Immunoblotting of brain lysates with the anti-Vglut1 antibody. (C–E) Co-staining with anti-Pvalb7 (green) and anti-Vglut1 (magenta) antibodies. (C–E) Sagittal sections with anterior to the left; low (C), medium (D), and high (E) magnification views. (D, E) Corpus cerebelli (CCe). Vglut1+ dots (presynaptic boutons of parallel fibers) abutted the dendrites but not the soma (asterisk) of Purkinje cells in the ML. (F, G) Co-staining with anti-Pvalb7 (green) and anti-Gad1 (magenta) antibodies. Gad1+ dots (presynaptic boutons of GABAergic interneurons) abut the dendrites and somata (asterisks) of Purkinje cells. The abbreviations are as described in Fig. 1. Scale bars: 200 μm (C), 100 μm (F) and 20 μm (D, E, G). EXPRESSION / LABELING:
|
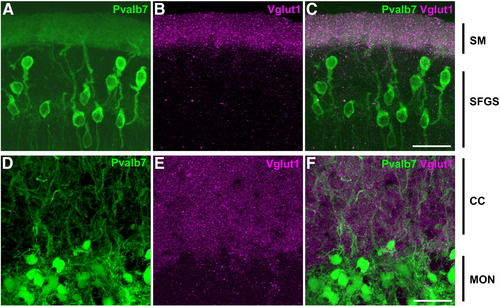
Cerebellum-like structures. Co-staining of anti-Pvalb7 (green) and anti-Vglut1 (magenta) antibodies in the cerebellum-like structures in the optic tectum and antero-dorsal hindbrain: the TL-SM-type I neuron (A–C) and EG-CC-MON circuitries (D–F). Sagittal sections with dorsal to the top. Pvalb7 (A, D) and Vglut1 (B, E) signals and merged images (C, F) are shown. In the TL-SM-type I neuron circuitry, Pvalb7 is expressed in type I neurons in the stratum fibrosum et griseum superficiale (SFGS) of the torus longitudinalis (TL) and their dendrites in the stratum marginale (SM, J), and Vglut1 was detected in the SM. Note that morphology of type I neurons is different from Purkinje cells in the cerebellum: type I neurons have one long primary dendrite that branches far from the soma. A primary dendrite of some type I neurons is not observed because of the plane and width of the section (A). In the EG-CC-MON circuitry, Pvalb7 was detected in the crest cells in the MON and their dendrites in the CC, and Vglut1 was detected in the CC. Other abbreviations are described in Fig. 1. Scale bars: 20 μm. EXPRESSION / LABELING:
|
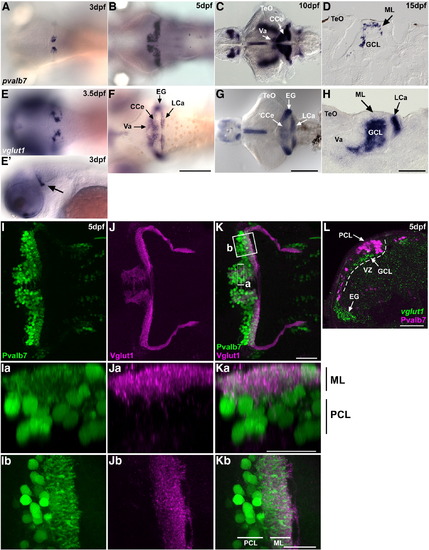
Development of the cerebellum at larval stages. (A–D) Expression of parvalbumin7 (pvalb7) at 3 dpf (A), 5 dpf (B), 10 dpf (C), and 15 dpf (D). (E–H) Expression of vglut1(slc17a7) at 3.5 dpf (E), 5 dpf (F), 10 dpf (G), and 15 dpf (H). Dorsal views (A–C, E–G), lateral view at 3 dpf (E′), and sagittal sections (D, H). (I–K) Co-staining of 5-dpf larvae with anti-Pvalb7 (green) and anti-Vglut1 (magenta) antibodies. Pvalb7 (I, Ia, Ib) and Vglut1 (J, Ja, Jb) signals and merged images (K, Ka, Kb) are shown. (I–K) Dorsal views with anterior to the left. (Ia–Ka) Transverse-section images of box a in K generated by Z-stack data, with dorsal to the top. (Ib–Kb) High-magnification view of box b in K, with anterior to the left. Pvalb7+ dendrites extended to the ML dorsally (Ka) and posteriorly (Kb), and interacted with Vglut1+ presynaptic terminals of the parallel fibers at 5 dpf. (L) Co-staining 5-dpf cerebellum with a vglut1 riboprobe (green) and anti-Pvalb7 antibody (magenta). Transverse section with dorsal to the top. The ventricular zone (VZ) is indicated by a dotted line. The vglut1+ granule cell layer (GCL) formed beneath the Purkinje cell layer (PCL) by 5 dpf. EG, eminentia granularis; other abbreviation are described in Fig. 1. Scale bars: 500 μm (G), 200 μm (F), 100 μm (H), and 50 μm (K, Ka, Kb, L). EXPRESSION / LABELING:
|

Cerebellar mutants. (A–E) Wild-type, (F–J) evanescence (eva), (K–O) asynergy (asy), (P–T) gazami (gaz), and (U–Y) shiomaneki (sio) mutant larvae at 5 dpf. The embryos and larvae were treated with phenylthiourea to prevent pigmentation. The fixed 5-dpf larvae were stained with anti-Pvalb7 and Vglut1 antibodies. Bright-field images of the entire body (A, F, K, P, U) and the head region (B, G, L, Q, V). Lateral views with anterior to the left. Pvalb7 immunostaining (green; C, H, M, R, W), Vglut1 immunostaining (magenta; D, I, N, S, X), and merged images (E, J, O, T, Y). Dorsal views with anterior to the left. The eva and asy mutants had small eyes (indicated by arrows). Scale bars: 1 mm (U) and 200 μm (V, Y). |

Expression of vglut1 (slc17a7). In situ hybridization of sagittal (A, identical to Fig. 3B) and cross sections (B) of the adult cerebellum. Lines in A and B indicate the corresponding positions of section B and A, respectively. Magenta arrowheads indicate vglut1 expression in the torus longitudinalis (TL), and white arrows and arrowheads indicate its expression in the granule cell layer (GCL). The abbreviations are described in Fig. 1. TL, torus longitudinalis. Scale bars: 500 μm. |
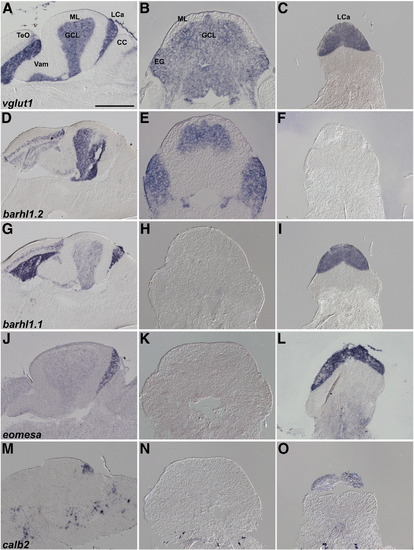
Expression of granule cell markers in Va, CCe, EG, and LCa. In situ hybridization of sagittal (A, D, G, J, M), and cross sections at the position of CCe/EG (B, E, H, K, N) and LCa (C, F, I, L, O). D, G, J, and M are identical to F, G, H, and I in Fig. 3. Note that expression of barhl1.1 and eomesa in the GCL is very low and not detected in the cross sections (H and K) but it is detected in the GCL of Va and CCe in the sagittal sections (G, J). Scale bar: 500 μm. |

olig2:EGFP+ axons and calretinin-immunoreactivity (CR-ir) in pretectal region. The brain of adult Tg(olig2:EGFP) fish were stained with anti-EGFP (green, A) and anti-calretinin antibodies (magenta, B). (C) Superimposed view of A and B. Sagittal section. The pretectal region is indicated by arrow. Note that both olig2:EGFP+ fibers and CR-ir+ neurons/fibers were detected in the preoptic regions, and also broadly in other regions of the brain. The abbreviations are described in Fig. 1. Scale bar: 500 μm. |

Unillustrated author statements EXPRESSION / LABELING:
PHENOTYPE:
|
Reprinted from Developmental Biology, 330(2), Bae, Y.K., Kani, S., Shimizu, T., Tanabe, K., Nojima, H., Kimura, Y., Higashijima, S.I., and Hibi, M., Anatomy of zebrafish cerebellum and screen for mutations affecting its development, 406-426, Copyright (2009) with permission from Elsevier. Full text @ Dev. Biol.