
- Title
-
Midkine-b regulates cell specification at the neural plate border in zebrafish
- Authors
- Liedtke, D., and Winkler, C.
- Source
- Full text @ Dev. Dyn.
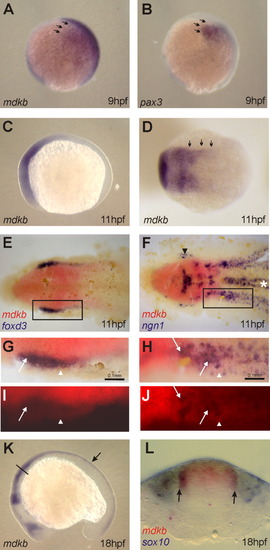
Expression of mdkb during early zebrafish development. A: Lateral view of an embryo at 90% epiboly showing mdkb expression in blue as analyzed by whole-mount in situ hybridization. B: Expression of pax3 in the lateral neural plate containing neural crest cells (ncc) precursors at the same embryonic stage. Arrows indicate overlapping expression of mdkb and pax3 in the presumptive ncc domain. C,D: Expression of mdkb at the three-somite stage (11 hours postfertilization [hpf]) in a lateral (C) and dorsal (D) view; arrows indicate expression at the edge of the neural plate at hindbrain level. E,G,I: Expression of mdkb (in red) and foxd3 (in blue) in the head/trunk region of the converging neural plate at the three-somite stage (dorsal view with anterior to the left). Note coexpression of foxd3 and mdkb in premigratory ncc precursors at the lateral neural plate border (G, higher magnification view of area boxed in E, brightfield; I, darkfield; arrows in G and I indicate foxd3 positive cells in the mdkb domain, arrowheads mark the lateral edge of the mdkb domain). F,H,J: Colocalization of mdkb and ngn1 expression in an area of forming Rohon-Beard sensory precursors (H, higher magnification brightfield view of boxed area; J, darkfield; white asterisk in F marks motor neuron precursors, black arrowhead labels trigeminal ganglia; arrows in H and J indicate ngn1-positive cells in the mdkb domain, arrowheads mark lateral edge of the mdkb domain). K: Expression of mdkb in a 18-somite stage embryo (18 hpf). Arrow indicates expression in the dorsal neural tube. L: Transverse section of an embryo at the level indicated in K, showing expression of mdkb in the dorsal neural tube (in red) and sox10 in ncc (in blue). Note overlapping expression at the border of the neural tube (marked by arrows). EXPRESSION / LABELING:
|
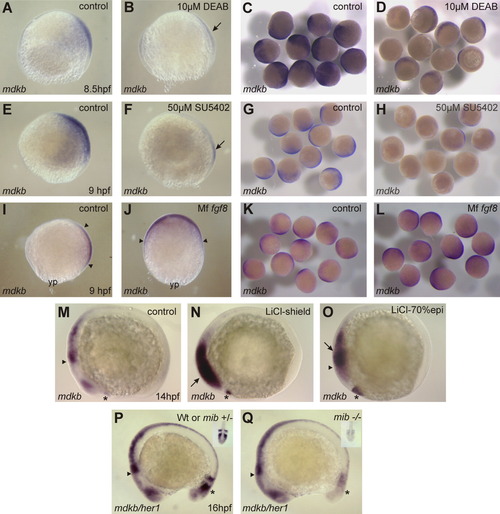
Regulation of mdkb transcription. A-D: Effect of inhibition of RA signaling on mdkb expression. A: Lateral view of mdkb expression in a dimethylsulfoxide (DMSO) -treated control embryo at 8.5 hours postfertilization (hpf). B: Lateral view of an embryo treated with 10 μM DEAB. Arrow indicates area of reduced mdkb expression. C: Group of DMSO-treated control embryos showing regular mdkb expression. D: Embryos treated with 10 μM DEAB showing reduced mdkb expression. E-H: Effect of FGF inhibition on mdkb expression. Lateral view of a control embryo at 9 hpf (E) and an embryo treated with 50 μM SU5402 (F). Arrow indicates area with reduced mdkb expression. Groups of control embryos (G) and SU5402-treated embryos (H) showing mdkb expression. I-L: Lateral views of embryos showing expression of mdkb in noninjected control embryos (I,K) and embryos injected with 30 pg of medaka fgf8 mRNA (J,L showing mdkb expression. I-L: Lateral views of embryos showing expression of mdkb in noninjecte) at 9 hpf. Arrowheads in I,J indicate the extension of the mdkb expression domain; yp, yolk plug. M-O: Expression of mdkb in embryos incubated with 0.3 M LiCl. Arrowheads mark the mid-hindbrain boundary (MHB), and asterisks mark the most anterior mdkb expression domain. (M) Control embryo. Note that mdkb expression is increased in embryos treated with LiCl at shield stage (N) and at 70% epiboly (O). P,Q: Expression of mdkb and her1 in wild-type or heterozygous (P) and homozygous (Q) mindbomb mutants (mibta52b). Note unaltered mdkb but reduced her1 expression in the tail bud of homozygous mib mutants (marked by asterisk). Insets show dorsal views of tail bud regions in P and Q. EXPRESSION / LABELING:
|
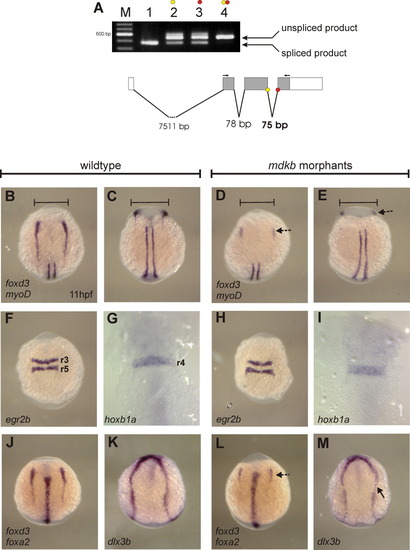
A: mdkb splice-site Morpholinos (MOs) block normal processing of endogenous mdkb pre-mRNA. Reverse transcriptase-polymerase chain reaction (RT-PCR) analysis of mdkb transcription in uninjected embryos (lane 1), embryos injected with one MO (Up, lane 2; Down, lane 3) and embryos co-injected with both splice-site MOs (lane 4). Lane M represents a 100-bp DNA size ladder (Invitrogen). The schematic drawing shows the organization of the mdkb pre-mRNA (red and yellow dots indicate blocked splice sites), intron sizes and regions of primer binding. B-E: No effects of reduced Mdkb activity on myoD expression in the adaxial mesoderm were observed, while foxd3 expression is reduced in premigratory ncc. Dorsal views of anterior (B,D), respectively posterior trunk regions (C,E) of the same embryos are shown. F-I: Normal hindbrain patterning in mdkb morphants, as evident by regular egr2b expression in rhombomeres r3 and r5, and hoxb1a expression in r4. J-M: No effects of reduced Mdkb activity on foxa2 expression in the axial mesoderm and on dlx3b expression, indicating regular convergence and size of the neural plate. EXPRESSION / LABELING:
|
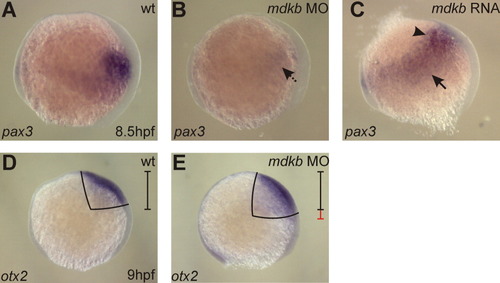
mdkb regulates early pax3 expression. A: Lateral view of pax3 expression in a control embryo at 80% epiboly (dorsal to the right). B: Reduced pax3 expression in embryo co-injected with mdkb Up and Down splice-site Morpholinos (MOs). The arrow marks an area with reduced pax3 expression. C: Expanded pax3 expression in an embryo injected with 150 pg of mdkb mRNA. The arrow marks a region of expanded pax3 expression, the arrowhead the anterior border of pax3 expression. D,E: otx2 expression in the anterior neural plate of control (D) and mdkb MO-injected embryos (E) at 90% epiboly. Note that the otx2 region is slightly expanded, suggesting that neural plate is not reduced in mdkb morphants. EXPRESSION / LABELING:
|
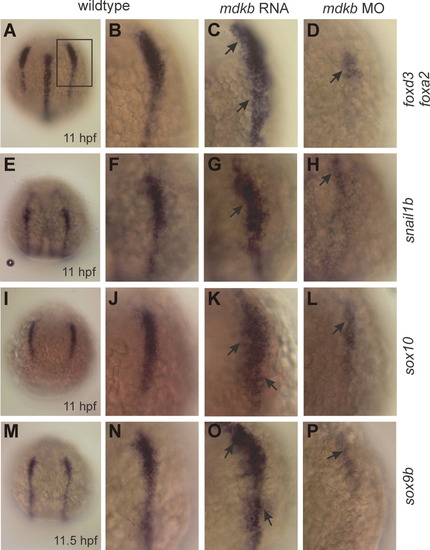
mdkb regulates formation of different subtypes of neural crest cells. A-P: Expression of foxd3/foxa2 (A-D), snail1b (E-H), sox10 (I-L), and sox9b (M-P) in noninjected wild-type embryos (first and second column), embryos injected with 150 pg of mdkb mRNA (third column) and mdkb splice-site Morpholinos (forth column). A, E, I, and M are dorsal views of whole embryos with anterior to the top, all other pictures are higher magnification views of corresponding regions marked by box in A. Arrows indicate areas of enhanced and reduced, respectively, expression. EXPRESSION / LABELING:
|
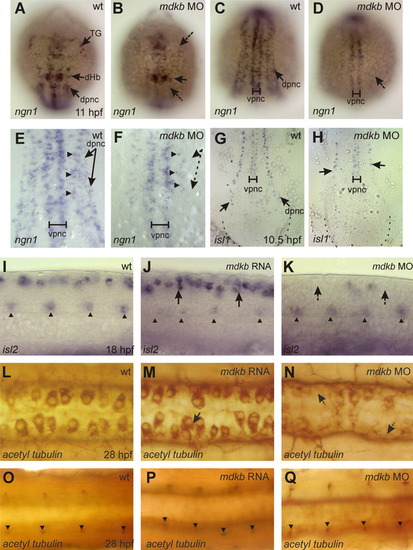
mdkb regulates formation of sensory neurons. A-H: Dorsal views of trunk regions in noninjected (A,C,E,G) and mdkb Morpholino (MO) -injected embryos (B,D,F,H) at the one- to three-somite stage showing ngn1 (A-F) and isl1 (G,H) expression. Note that the embryo in H is slightly delayed due to MO injection. Dorsal proneural cells (dpnc) are reduced in injected embryos at mid-hindbrain (arrows in A,B) and trunk level (arrows in C-H), while number of ventral proneural cells (vpnc) is not affected. Note remaining interneurons (arrowheads), but absent sensory neurons (arrows) in mdkb morphants (in E,F). I-K: Lateral views of trunk regions in embryos at the 18-somite stage showing isl2 expression in ventrally located motor neurons (arrowheads) and dorsal sensory Rohon-Beard (RB) neurons (arrows). Embryos injected with 150 pg of mdkb RNA (J) show enhanced numbers of dorsal RB, while motor neurons are not affected. In contrast, RB are reduced in mdkb MO-injected embryos (K). L-Q: Dorsal views of embryos at 28 hours postfertilization (hpf) immunostained with an antibody against acetylated tubulin. L-N: Focal planes at the level of dorsal sensory neurons. O-Q: Focal planes of the same embryos at the level of ventral motor neurons. Note increased RB cell number in mdkb RNA injected embryos (arrow in M) and reduced RB cell number in mdkb MO-injected embryos (arrow in N), while number of motor neurons is not affected (arrowheads in M-O). DHb, dorsal hindbrain; TG, trigeminal ganglia; VMb, ventral midbrain. EXPRESSION / LABELING:
PHENOTYPE:
|
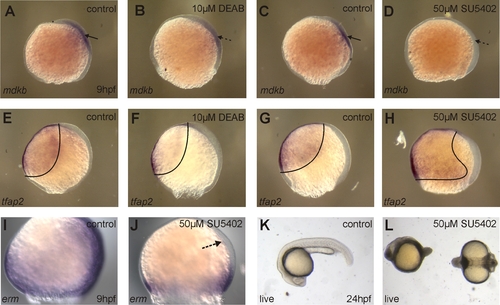
Effect of DEAB and SU5402 treatment on neural plate size. Incubation of embryos in 10 μM DEAB from shield stage until 8.5 hpf results in reduction of mdkb expression (A,B; marked by arrows), while expression of tfap2 in non-neural ectoderm and neural plate size is not affected (E,F). Incubation of embryos with SU5402 results in a reduction of both, mdkb expression (C,D) and neural plate size as indicated by an expanded tfap2 expression domain (G,H). erm expression is reduced in SU5402 treated embryos (I, J, arrowhead), as described in the literature (Raible and Brand, 2001). (K,L) Phenotypes of live embryos at 24hpf treated with 50μM SU5402, note severe necrosis. EXPRESSION / LABELING:
|
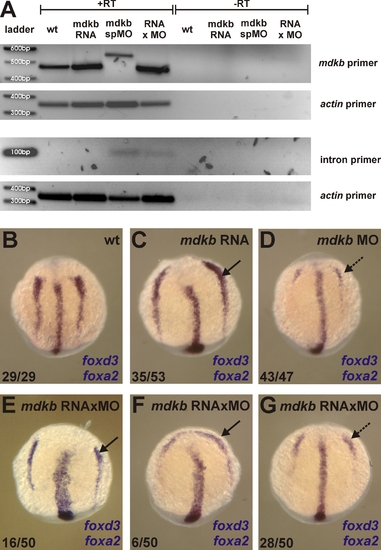
RNA rescue of neural crest defects in mdkb morphants. 100 pg mdkb RNA and 9.4 ng mdkb splice MOs (4.7 ng each) were injected individually or together into early zebrafish embryos. For co-injections, embryos were first injected with Morpholino at the one-cell stage, followed by RNA injection approximately 20 minutes later. 30 embryos each were collected for cDNA synthesis, the remaining embryos were used for in-situ analysis. (A) RT-PCR analysis of mdkb transcripts in non-injected embryos (lane 2), mdkb RNA (lane 3), mdkb splice MO (lane 4) and double injected embryos (lane 5). Top panel shows PCR products using exon specific primers, third panel from top shows products using primers covering the MO targeted intron. Two independent RT-PCRs were run for exon and intron primers. Analysis of actin expression was used as loading control in each experiment. The right panel represents RT controls (cDNA synthesis in the absence of reverse transcriptase). Non-spliced mdkb transcripts were detected in mdkb splice MO and double injected embryos (see lane with intron primer). Note that non-spliced products could not be detected using the exon primers due to excess of competing transcripts of injected RNA. (B-G) Analysis of foxd3 expression in ncc and foxa2 in axial mesoderm. Numbers indicate embryos with respective phenotype. mdkb MO injection results in ncc reduction in vast majority of analyzed embryos (D), while co-injection with RNA leads to a significant number of embryos with normal (E) or expanded ncc (F) indicating partial rescue of ncc defects. EXPRESSION / LABELING:
|
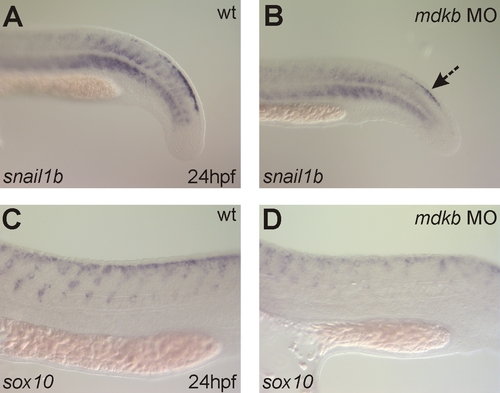
Partial recovery of ncc in mdkb morphants at 24hpf. Expression of snail1b (A,B) and sox10 (C,D) in embryos injected with mdkb Morpholinos. Dashed arrow in B labels ncc in the tail. EXPRESSION / LABELING:
|
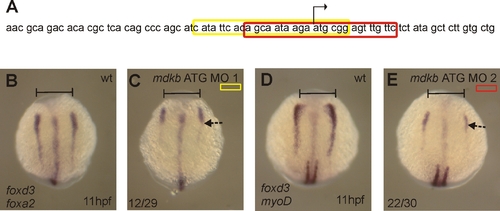
Effect of mdkb ATG Morpholinos on premigratory ncc formation. (A). Sequences around mdkb translational start site (arrow) that are targeted by ATG MO 1 (yellow) and ATG MO 2 (red). Effect of mdkb ATG MO 1 (B,C) and mdkb ATG MO 2 (D,E) injected at 18.75 ng/nl on foxd3 expression in embryos at 12hpf. Numbers indicate embryos with reduced foxd3 expression. Note that axial mesoderm (marked by foxa2 expression) and adaxial mesoderm (myoD expression) form normally in ATG MO injected embryos. EXPRESSION / LABELING:
|