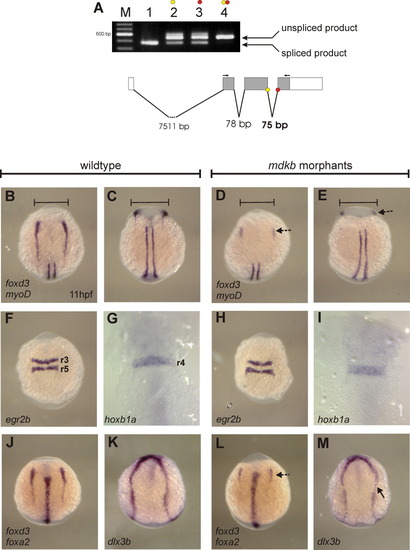
A: mdkb splice-site Morpholinos (MOs) block normal processing of endogenous mdkb pre-mRNA. Reverse transcriptase-polymerase chain reaction (RT-PCR) analysis of mdkb transcription in uninjected embryos (lane 1), embryos injected with one MO (Up, lane 2; Down, lane 3) and embryos co-injected with both splice-site MOs (lane 4). Lane M represents a 100-bp DNA size ladder (Invitrogen). The schematic drawing shows the organization of the mdkb pre-mRNA (red and yellow dots indicate blocked splice sites), intron sizes and regions of primer binding. B-E: No effects of reduced Mdkb activity on myoD expression in the adaxial mesoderm were observed, while foxd3 expression is reduced in premigratory ncc. Dorsal views of anterior (B,D), respectively posterior trunk regions (C,E) of the same embryos are shown. F-I: Normal hindbrain patterning in mdkb morphants, as evident by regular egr2b expression in rhombomeres r3 and r5, and hoxb1a expression in r4. J-M: No effects of reduced Mdkb activity on foxa2 expression in the axial mesoderm and on dlx3b expression, indicating regular convergence and size of the neural plate.
|
