- Title
-
Ptena and ptenb genes play distinct roles in zebrafish embryogenesis
- Authors
- Croushore, J.A., Blasiole, B., Riddle, R.C., Thisse, C., Thisse, B., Canfield, V.A., Robertson, G.P., Cheng, K.C., and Levenson, R.
- Source
- Full text @ Dev. Dyn.
|
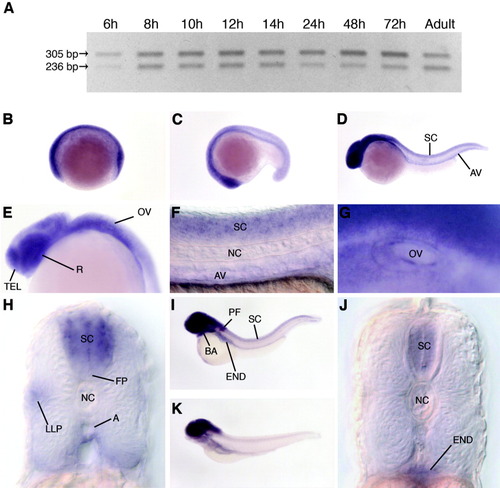
Expression of zebrafish ptena mRNA during embryogenesis. Expression of ptena was analyzed by RT-PCR and whole-mount in situ hybridization. A: Expression of ptena splice variants during zebrafish development determined by RT-PCR. Bands of 305 and 236 bp represent fragments of the long and short splice variants, respectively. B-K: Expression of ptena determined by whole-mount in situ hybridization. B: Early somitogenesis, lateral view. C: Mid-somitogenesis, lateral view. D: Twenty-four hpf, lateral view. E: Twenty-four hpf, lateral view of head. F: Twenty-four hpf, lateral view of tail. G: Thirty-six hpf, lateral view of otic vesicle. H: Twenty-four hpf, transverse section of trunk. I: Forty-eight hpf, lateral view. J: Forty-eight hpf, transverse section of trunk. K: Five dpf, lateral view. A, aorta wall; AV, axial vasculature; BA, branchial arches; END, endoderm; FP, floor plate; LLP, lateral line primordium; NC, notochord; OV, otic vesicle; PF, pectoral fin; R, retina; SC, spinal cord; TEL, telencephalon. |
|
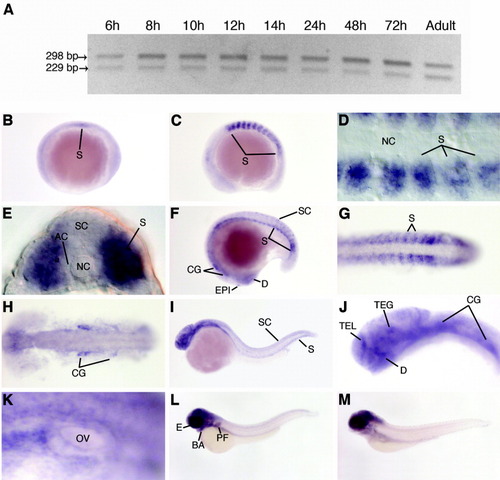
Expression of zebrafish ptenb mRNA during embryogenesis. Expression of ptenb was analyzed by RT-PCR and whole-mount in situ hybridization. A: Expression of ptenb splice variants during zebrafish development determined by RT-PCR. Bands of 298 and 229 bp represent fragments of the long and short splice variants, respectively. B-K: Expression of ptenb determined by whole-mount in situ hybridization. B: Early somitogenesis, lateral view. C-H: Mid-somitogenesis. C: Ten-somite stage, lateral view. D: 10-somite stage, dorsal view of somites obtained with differential interference contrast microscopy. E: Ten-somite stage, transverse section. F: Eighteen-somite stage, lateral view. G: Eighteen-somite stage, dorsal view of tail. H: Eighteen-somite stage, dorsal view of head. I: Twenty-four hpf, lateral view. J: Twenty-four hpf, lateral view of head. K: Thirty-six hpf, lateral view of otic vesicle. L: Forty-eight hpf, lateral view. M: Five dpf, lateral view. AC, adaxial cells; BA, branchial arches; CG, cranial ganglia; D, diencephalon; EPI, epiphysis; E, eye; NC, notochord; OV, otic vesicle; PF, pectoral fin; S, somite; SC, spinal cord; TEL, telencephalon; TEG, tegmentum. |
|
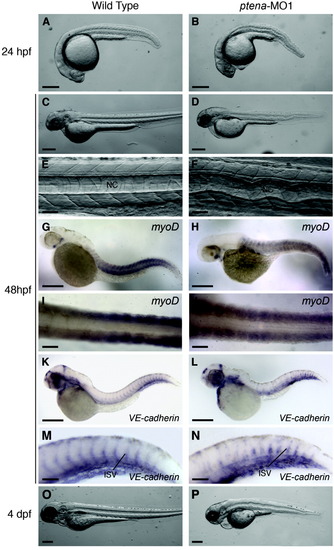
Effect of ptena-MO1 morpholino on zebrafish development. All panels (except I and J) are lateral views with anterior to the left. A: Twenty-four hpf, wild type embryo. B: Twenty-four hpf, ptena morphant. C: Forty-eight hpf, wild type embryo. D: Forty-eight hpf, ptena morphant. E: Forty-eight hpf, trunk of wild type embryo. F: Forty-eight hpf, trunk of ptena morphant. G-J: Forty-eight hpf, in situ hybridization using myoD probe. G: Wild type embryo. H: ptena morphant. I: Tail of wild type embryo, dorsal view. J: Tail of ptena morphant, dorsal view. K-P: Forty-eight hpf, in situ hybridization using VE-cadherin probe. K: Wild type embryo. L: ptena morphant. M: Tail of wild type embryo. N: Tail of ptena morphant. O: Four dpf, wild type embryo. P: Four dpf, ptena morphant. Scale bars: A-D, G, H, K, L, O, P = 250 μm; E, F, I, J, M, N = 50μm. |
|
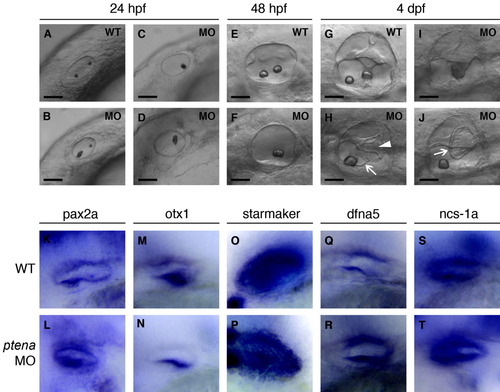
Effect of ptena-MO1 morpholino on zebrafish inner ear development. All panels are lateral views of the otic vesicle with anterior to the left. A: Twenty-four hpf, wild type embryo. B-D: Twenty-four hpf, ptena morphants. E: Forty-eight hpf, wild type embryo. F: Forty-eight hpf, ptena morphant. G: Four dpf, wild type embryo. H-J: Four dpf, ptena morphants. K-T: Forty-eight hpf, in situ hybridization using ear-specific markers. K: pax2a, wild type embryo. L: pax2a, ptena morphant. M: otx1, wild type embryo. N: otx1, ptena morphant. O: starmaker, wild type embryo. P: starmaker, ptena morphant. Q: dfna5, wild type embryo. R: dfna5, ptena morphant. S: ncs-1a, wild type embryo. T: ncs1-a, ptena morphant. Scale bars in A-J = 25 μm. Arrowhead indicates site where epithelial pillars fail to fuse. Arrows point to abnormal tissue masses. |
|
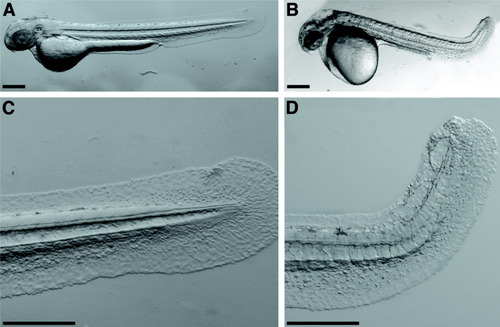
Effect of ptenb-MO1 morpholino on zebrafish development. All panels are lateral views of 48-hpf embryos with anterior to the left. A: Wild type embryo. B: ptenb morphant. C: Tail of wild type embryo. D: Tail of ptenb morphant. Scale bars = 250 μm. PHENOTYPE:
|
|
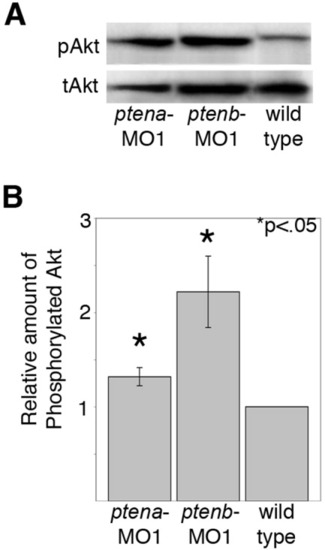
Lipid phosphatase activity of zebrafish pten genes. Lysates were prepared from wild type embryos as well as ptena and ptenb morphants at 48 hpf (30 embryos/group). Proteins were separated by SDS-PAGE and transferred to a nitrocellulose filter. Blots were probed with an anti-Akt antibody, stripped, and reprobed with an anti-phospho-Akt (pAkt) antibody. A: Western blot. B: Quantitation of bands by laser densitometry. The bars for ptena (n = 6 separate experiments) and ptenb (n = 4 separate experiments) represent the relative ratio of pAkt to total Akt (tAkt) compared to wild type embryos. The error bars represent the standard error of the mean. The asterisk indicates a statistically significant increase in the ratio of pAkt to tAkt (P < 0.05) as calculated by an unpaired Students t-test. PHENOTYPE:
|

Unillustrated author statements |

