
|
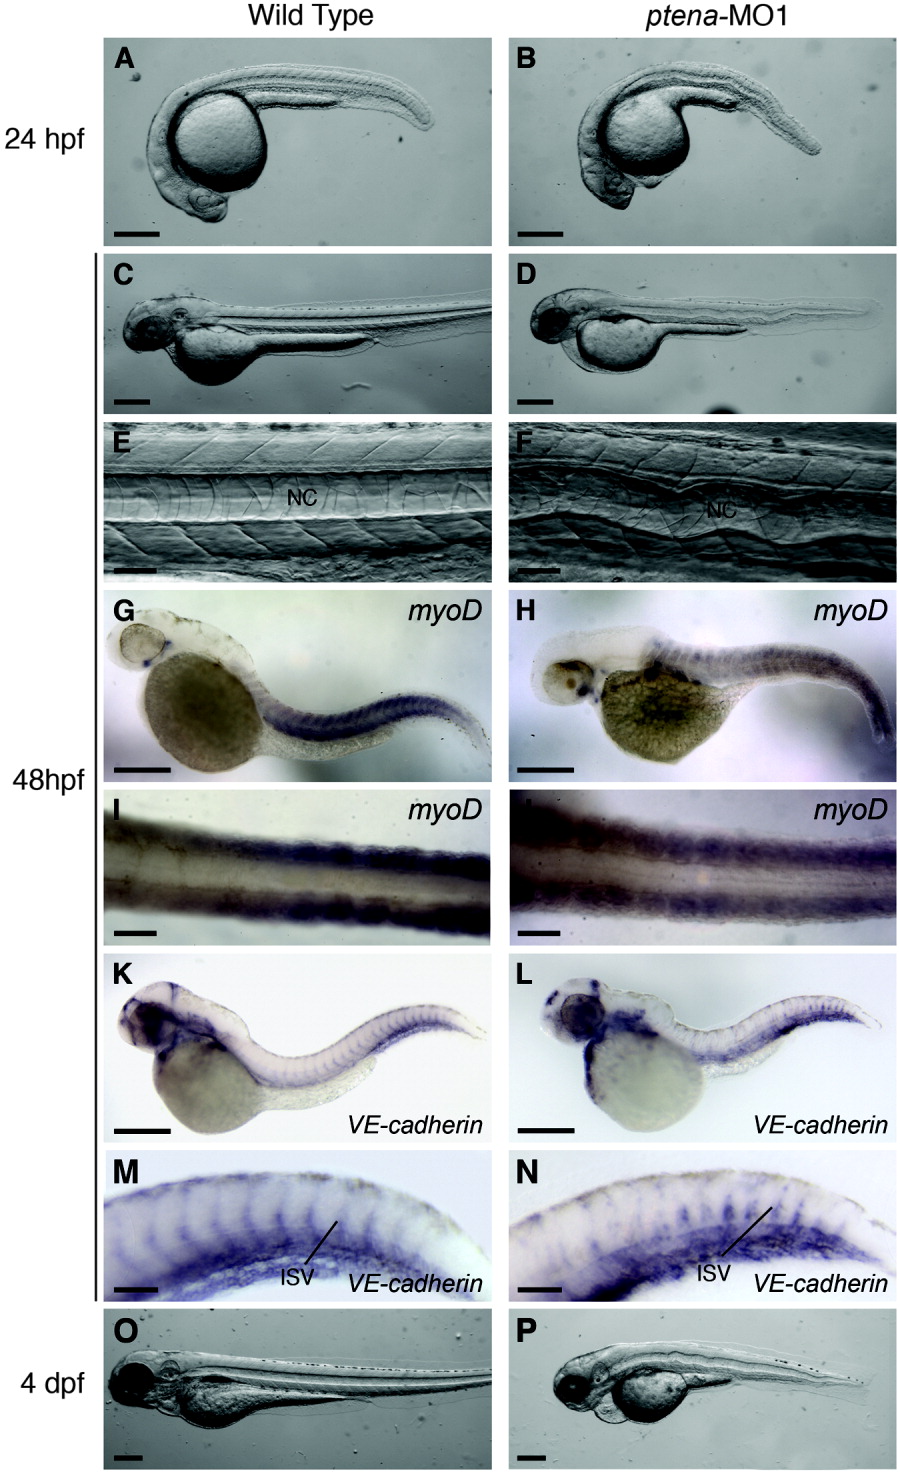
Fig. 5 Effect of ptena-MO1 morpholino on zebrafish development. All panels (except I and J) are lateral views with anterior to the left. A: Twenty-four hpf, wild type embryo. B: Twenty-four hpf, ptena morphant. C: Forty-eight hpf, wild type embryo. D: Forty-eight hpf, ptena morphant. E: Forty-eight hpf, trunk of wild type embryo. F: Forty-eight hpf, trunk of ptena morphant. G-J: Forty-eight hpf, in situ hybridization using myoD probe. G: Wild type embryo. H: ptena morphant. I: Tail of wild type embryo, dorsal view. J: Tail of ptena morphant, dorsal view. K-P: Forty-eight hpf, in situ hybridization using VE-cadherin probe. K: Wild type embryo. L: ptena morphant. M: Tail of wild type embryo. N: Tail of ptena morphant. O: Four dpf, wild type embryo. P: Four dpf, ptena morphant. Scale bars: A-D, G, H, K, L, O, P = 250 μm; E, F, I, J, M, N = 50μm.