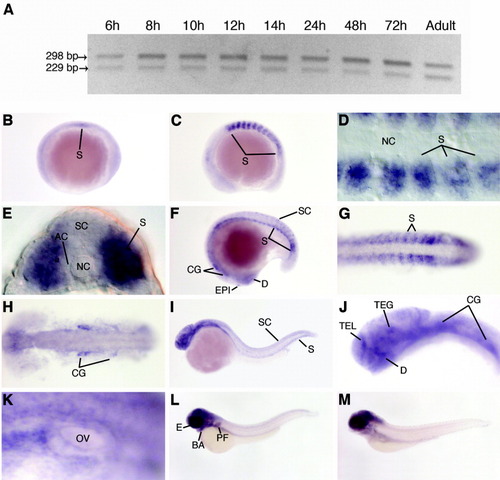
Expression of zebrafish ptenb mRNA during embryogenesis. Expression of ptenb was analyzed by RT-PCR and whole-mount in situ hybridization. A: Expression of ptenb splice variants during zebrafish development determined by RT-PCR. Bands of 298 and 229 bp represent fragments of the long and short splice variants, respectively. B-K: Expression of ptenb determined by whole-mount in situ hybridization. B: Early somitogenesis, lateral view. C-H: Mid-somitogenesis. C: Ten-somite stage, lateral view. D: 10-somite stage, dorsal view of somites obtained with differential interference contrast microscopy. E: Ten-somite stage, transverse section. F: Eighteen-somite stage, lateral view. G: Eighteen-somite stage, dorsal view of tail. H: Eighteen-somite stage, dorsal view of head. I: Twenty-four hpf, lateral view. J: Twenty-four hpf, lateral view of head. K: Thirty-six hpf, lateral view of otic vesicle. L: Forty-eight hpf, lateral view. M: Five dpf, lateral view. AC, adaxial cells; BA, branchial arches; CG, cranial ganglia; D, diencephalon; EPI, epiphysis; E, eye; NC, notochord; OV, otic vesicle; PF, pectoral fin; S, somite; SC, spinal cord; TEL, telencephalon; TEG, tegmentum.
|
