|
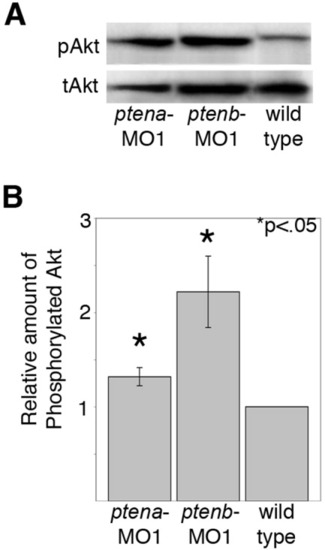
Lipid phosphatase activity of zebrafish pten genes. Lysates were prepared from wild type embryos as well as ptena and ptenb morphants at 48 hpf (30 embryos/group). Proteins were separated by SDS-PAGE and transferred to a nitrocellulose filter. Blots were probed with an anti-Akt antibody, stripped, and reprobed with an anti-phospho-Akt (pAkt) antibody. A: Western blot. B: Quantitation of bands by laser densitometry. The bars for ptena (n = 6 separate experiments) and ptenb (n = 4 separate experiments) represent the relative ratio of pAkt to total Akt (tAkt) compared to wild type embryos. The error bars represent the standard error of the mean. The asterisk indicates a statistically significant increase in the ratio of pAkt to tAkt (P < 0.05) as calculated by an unpaired Students t-test.
|