
- Title
-
Analysis of the zebrafish smoothened mutant reveals conserved and divergent functions of hedgehog activity
- Authors
- Chen, W., Burgess, S., and Hopkins, N.
- Source
- Full text @ Development
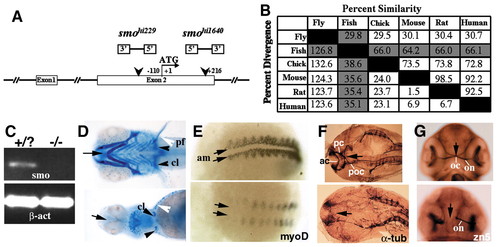
Homozygotes of two insertional mutant alleles in the zebrafish smo gene display phenotypes characteristic of a Hh signaling deficiency. Unless specified otherwise, wild type is above and anterior is on the left in each panel in all figures. (A) A schematic drawing of the two alleles indicating the locations and orientations of the proviral insertions. (B) Sequence pair distances of all known Smo proteins using the Clustal method with PAM250 residue weight table. Zebrafish column and row are highlighted. (C) RT-PCR analysis showing the lack of smo mRNA in the mutants. β-act, β-actin. (D) Ventral view of Alcian Blue-stained wild-type and mutant embryos at 120 hpf showing small head, posterior cyclopia, and absence of cartilaginous jaw and brachial arches (arrow), much reduced cleithria (black arrowhead), and absence of pectoral fins (white arrowhead) in the mutant. pf, pectoral fin; cl, cleithrium. (E) Posterior view of wild-type and mutant embryos at 14 hpf after wholemount in situ hybridization with antisense myoD probes showing the lack of adaxial mesoderm in the mutants (arrows). am, adaxial mesoderm. (F) Flattened dorsal view of head region of acetylated α-tubulin antibody stained wild-type and mutant embryos at 24 hpf, showing the absence of all three commissures in the forebrain and midbrain (arrow). ac, anterior commissure; pc, posterior commissure; poc, post-optic commissure. (G) Ventral view of Zn-5 stained wild-type and mutant embryos at 48 hpf showing failure of optic chiasm formation in the mutant embryo (arrow). Anterior points upwards. oc, optic chiasm; on, optic nerve. EXPRESSION / LABELING:
|
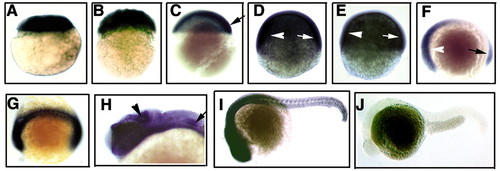
Expression of smo mRNA during early zebrafish development. (A,B) Side views of a two-cell stage (A) and a 128-cell stage (B) embryo showing maternal expression. (C) Lateral view of an embryo at 5 1/2 hpf showing general expression with a shallow dorsal-ventral gradient. Arrow points to the future organizer region. (D,E) Lateral views of wild-type (D) and mutant (E) embryos at 8 hpf showing higher expression in the future head (arrowhead) and tail (arrow) regions. Note much lower but detectable expression in the mutant. (F) Lateral view of a tail-bud stage embryo showing expression of smo mRNA in the head (arrowhead) and tail (arrow) regions. (G) Dorsal view of an embryo at 14 hpf demonstrating expression in the midline, adaxial mesoderm and somitic mesoderm. (H,I) Expression in wild-type embryos at 26 hpf. In the head region (H), higher levels of expression are seen in the tectum (arrowhead), epiphysis, ventral forebrain and midbrain, and pectoral fin bud (arrow). In the trunk region, higher levels of expression are found in the neural tube, somites and gut. (J) Lateral view of a mutant embryo at 26 hpf showing the absence of smo mRNA expression. |
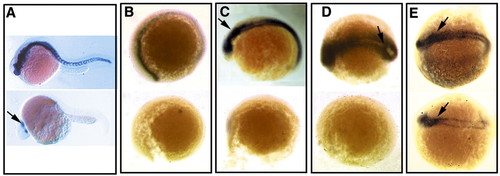
Essential and conserved role of vertebrate smo in Hh signaling. (A,B) Lateral view of wild-type and mutant embryos at 24 hpf (A) and 12 hpf (B) demonstrating the absence of ptc1 expression in the mutants. (C-E) ptc-1 expression in response to manipulation of Hh signaling components in wild-type and mutant embryos indicates a conserved role of smo in the pathway in zebrafish. Embryos were injected at one- to two-cell stages and ptc1 expression is determined at 12 hpf. (C) shh mRNA injection. (D) twhh mRNA injection. (E) PKI mRNA injection. Arrows indicate ectopic expression. EXPRESSION / LABELING:
|
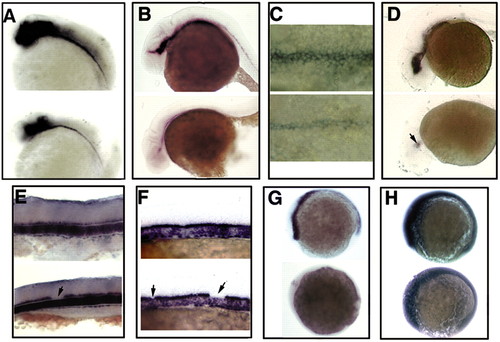
MFP development is independent of Hh activity in zebrafish. (A,B) Lateral view of wildtype and mutant embryos at 24 hpf showing FP markers such as shh (A) and axial (B) are present at reduced levels in smo embryos. (C) Close up dorsal view of axial expression in embryos at 24 hpf, indicating the lack of LFP and the presence of MFP in the mutant. (D) Expression of axial is markedly reduced in mutant embryos at 35 hpf. Axial can be seen in a small region in the ventral midbrain (arrow). (E) Lateral view of the expression of the MFP marker type II collagen 1a (col2a1) at 30 hpf indicating the fragmentation of MFP in the mutant (arrow). (F) Lateral view of col2a1 expression at 24 hpf indicating that 100 mM cyclopamine treatment from 4 to 10 hpf accelerated gap formation but did not eliminate the development of MFP. Arrows indicate gaps. (G) Side view of ptc1 expression in wild embryos at 10 hpf with (bottom) or without (top) 100 mM cyclopamine treatment showing that the treatment completely eliminates Hh activity. (H) Side view of ptc1 expression in the same batches of embryos as in (G) but sampled 2 hours after washing off cyclopamine, which indicates the inhibition is reversible. |
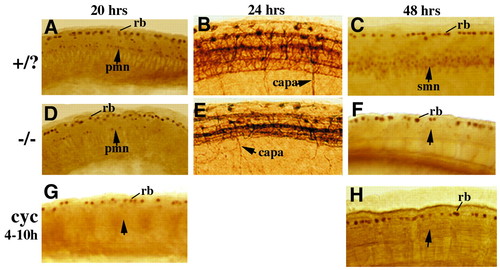
Maternal and zygotic smo function in MN development. (A,D,G) Lateral views of islet-1/2 antibody staining showing MNs in wild-type (A), smo mutant (D) and cyclopamine treated wildtype (G) embryos at 20 hpf. Mutant embryos have a decreased number of PMNs (arrow). The decrease becomes more severe in the caudal spinal cord. Cyclopamine treatment during gastrulation completely eliminates PMN formation (G). (B,E) Flattened lateral views of acetylated α-tubulin staining showing axons of primary neurons at 24 hpf. The axons of caudal PMN (CaP) in each hemisegment extend down (B, arrow), while CaP axons in the mutant branch and extend randomly (E, arrow). (C,F,H) Lateral views of Islet- 1/2 antibody stained embryos at 48 hpf. A large number of SMNs are seen in the wild-type embryos (C, arrow), whereas few can been seen in the mutant (F, arrow). The PMNs disappear almost completely. Treatment of embryos with cyclopamine during gastrulation in wild-type embryos also leads to the absence of SMN formation (H, arrow). capa, caudal primary motoneuron axons; pmn, primary motoneuron; smn, secondary motoneuron; rb, Rohon-Beard neurons. EXPRESSION / LABELING:
PHENOTYPE:
|
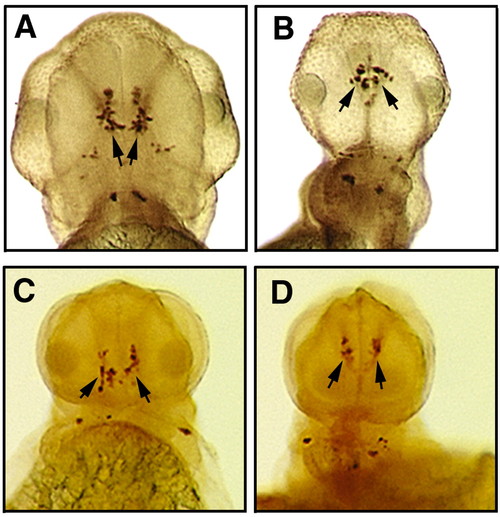
Midbrain DA neuron specification is independent of Smo and Hh activity. All are ventral views of anti-TH stained embryos at 48 hpf. Anterior is upwards. (A,B) Specification of midbrain DA neurons is normal in smo mutant embryos (B), but the number is only about half that in wild-type embryos (A). (C,D) Inhibition of Hh activity during gastrulation does not impair the specification of midbrain DA neurons in either wild-type (C) or mutant (D) embryos. Arrows indicate ventral midbrain DA neurons. PHENOTYPE:
|
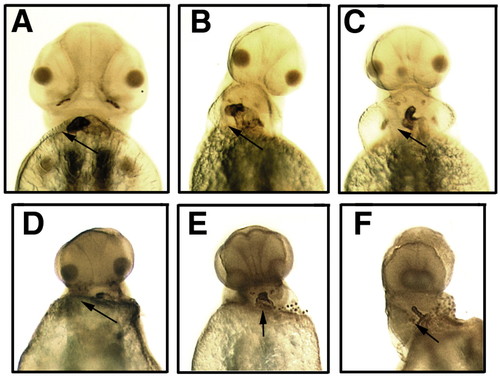
Hh activity and heart looping. All are ventral views of MF- 20-stained embryos at 48 hpf. Ventricle is stained darker than aorta. Anterior points upwards. Arrows indicate looping direction. (A-C) Despite morphological abnormalities, the heart of mutants (B,C) always loops to the right, as in wild-type embryos (A). (D-F) Inhibition of Hh activity by cyclopamine during gastrulation does not randomize heart looping. Morphology of the hearts are severely affected by the treatment in both wild-type (D,E) and mutants (F). Occasionally, the hearts of some treated embryos do not loop (E). However, reversal of looping has not been observed. |
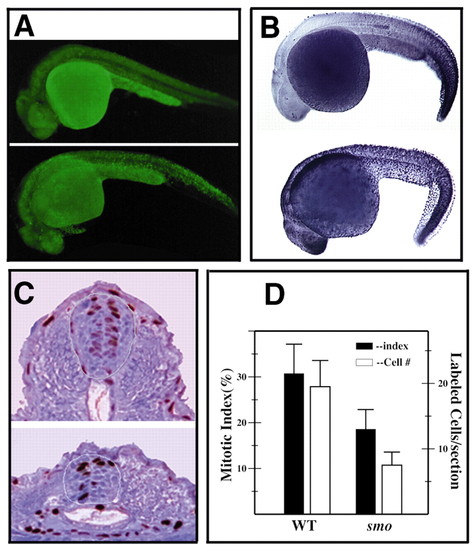
smo and regulation of cell proliferation and cell death. (A,B) Lateral view of embryos at 26 hpf showing a general increase of cell death in smo mutants. Embryos in A are stained live with Acridine Orange. Embryos in B are stained using the TUNEL protocol. (C,D) Decreased cell proliferation in smo mutants at 28 hpf. Embryos were labeled with BrdU and stained using an anti- BrdU antibody. (C) Representative cross sections of the cervical region of stained embryos that show fewer labeled cells as well as lower total cell numbers in the mutant. The border of the spinal cord is outlined. (D) Graph that summarizes the cell proliferation data in the cervical spinal cord of three wild-type and three mutant embryos. Mitotic index is the percentage of BrdU-labeled cells in the neural tube. Error bar shows s.d. PHENOTYPE:
|