
|
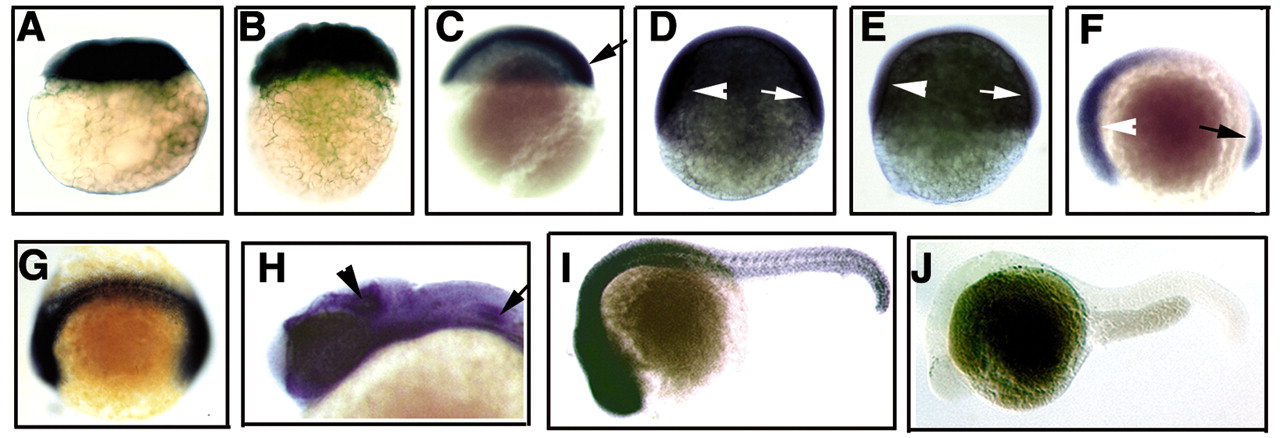
Fig. 2 Expression of smo mRNA during early zebrafish development. (A,B) Side views of a two-cell stage (A) and a 128-cell stage (B) embryo showing maternal expression. (C) Lateral view of an embryo at 5 1/2 hpf showing general expression with a shallow dorsal-ventral gradient. Arrow points to the future organizer region. (D,E) Lateral views of wild-type (D) and mutant (E) embryos at 8 hpf showing higher expression in the future head (arrowhead) and tail (arrow) regions. Note much lower but detectable expression in the mutant. (F) Lateral view of a tail-bud stage embryo showing expression of smo mRNA in the head (arrowhead) and tail (arrow) regions. (G) Dorsal view of an embryo at 14 hpf demonstrating expression in the midline, adaxial mesoderm and somitic mesoderm. (H,I) Expression in wild-type embryos at 26 hpf. In the head region (H), higher levels of expression are seen in the tectum (arrowhead), epiphysis, ventral forebrain and midbrain, and pectoral fin bud (arrow). In the trunk region, higher levels of expression are found in the neural tube, somites and gut. (J) Lateral view of a mutant embryo at 26 hpf showing the absence of smo mRNA expression.