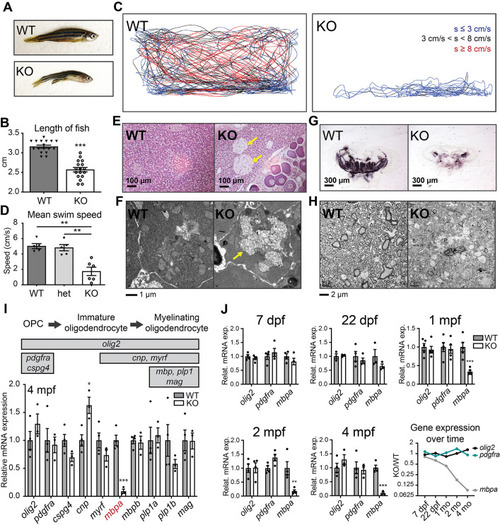
Psap KO zebrafish exhibit impaired locomotion, storage material accumulation and myelin loss without significant loss of oligodendrocyte markers. (A) Representative images of a 4 mpf psap+63/+63 zebrafish and WT sibling. Length distributions of 4 mpf WT and psap KO zebrafish are shown in B. (B) Length measurements of 4 mpf psap+63/+63 zebrafish and WT siblings. n=17 WT, 17 psap+63/+63 fish. A decreased length was observed in nearly all psap+63/+63 and psap−14/−14 zebrafish for each generation examined. (C) Swim behavior tracking for 4 mpf psap−14/−14 and WT zebrafish. Disrupted locomotion was present in all psap+63/+63 and psap−14/−14 zebrafish for each generation examined. Representative data from five WT and six psap−14/−14 zebrafish. s, swim speed. Zebrafish were filmed from the side of a 2.75-l fish tank. The filming area encompasses the entire side view of the tank and is ∼28 cm in length and 13 cm in height. (D) Mean swim speed of 4 mpf WT, psap−14/+ and psap−14/−14 zebrafish. (E) H&E staining of 4 mpf psap+63/+63 and WT zebrafish liver sections. Representative data from three WT, one psap−14/−14 and three psap+63/+63 zebrafish. Arrows point to regions containing large, foamy cell clusters. (F) Transmission electron microscopy (TEM) of 4 mpf psap+63/+63 and WT zebrafish livers. The arrow indicates regions of storage material accumulation. Representative data from three WT and three psap+63/+63 zebrafish. (G) Black Gold II staining of frozen brain sections from 4 mpf psap+63/+63 zebrafish and WT siblings. Representative data from five WT and five psap+63/+63 zebrafish. Additional serial sections are in Fig. S5, and several brain sections from G are also reproduced among the sequential sections in Fig. S5. (H) TEM of optic nerve sections from 4 mpf psap+63/+63 zebrafish and WT siblings. Representative data from five WT and six psap+63/+63 zebrafish. (I) Schematic of the expression of stage-specific marker genes (top). qRT-PCR of major oligodendrocyte differentiation markers in 4 mpf psap+63/+63 and WT sibling zebrafish brains (bottom). Representative data from two independent datasets; n=4 WT and 4 psap+63/+63 for each dataset. (J) qRT-PCR of olig2, pdgfra and mbpa over the course of psap+63/+63 and WT sibling zebrafish brain development. Representative data from at least two independent datasets for each time point; n=3-5 WT and 3-5 psap+63/+63 for each dataset. Data show the mean±s.e.m. For B,D,I,J, two-tailed unpaired Student's t-test was used. *P<0.05; **P<0.01, ***P<0.001.
|
