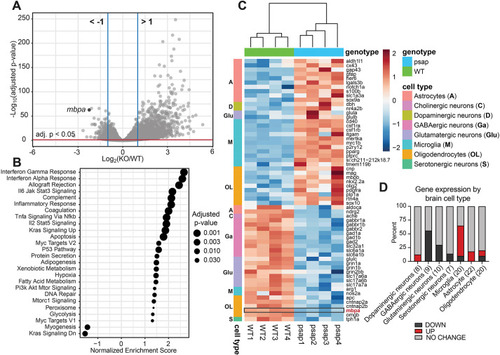
Brain transcriptomics identifies upregulated inflammation and mTORC1 signaling in psap+63/+63 zebrafish. (A) Volcano plot of all annotated genes from transcriptomics analysis of 4 mpf WT (n=4) and psap+63/+63 (n=4) zebrafish brains. mbpa is indicated on graph. Differential expression analysis data are in Table S3. (B) Gene set enrichment analysis (GSEA) of transcriptomics data (all genes from Table S3) using the Hallmark gene sets (MSigDB Collections). Additional GSEA analyses are in Table S4. (C) Hierarchical clustering analysis of WT and psap+63/+63 RNA sequencing data based on a manually curated list of 98 brain cell-type-specific marker genes (Table S5). The graph displays the 61 significantly deregulated genes (adjusted P-value <0.05) from the curated list. The boxed region corresponds to mbpa (third gene from bottom). (D) Percentage of up- and down-regulated brain cell type-specific marker genes (Table S5). Numbers in parentheses denote the number of genes in each cell type. ‘UP’ and ‘DOWN’ denote statistically significant (adjusted P-value <0.05) genes for which the relative (KO/WT) expression >1.5 and <0.67, respectively; all additional genes are designated ‘NO CHANGE’.
|
