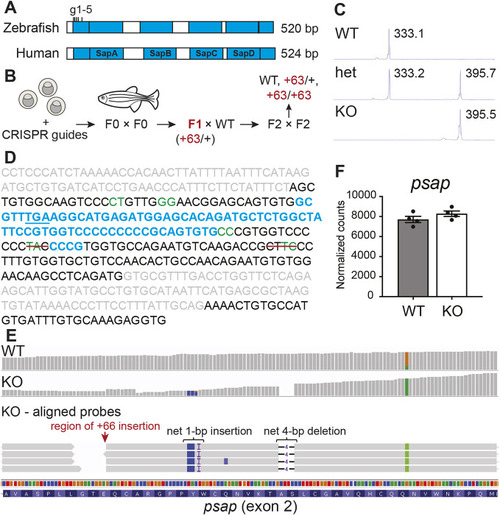
A zebrafish model of combined saposin deficiency. (A) Comparison between human (UniProt: P07602) and zebrafish (UniProt: B8JI17) saposin (blue) domains (detailed amino acid sequence alignment can be found in Fig. S1). CRISPR-Cas9 guide sites (located within exon 2) are indicated. (B) Schematic of combined saposin deficiency model generation in the zebrafish. (C) DNA fragment analyses of psap PCR fragments from WT and mutant zebrafish, demonstrating the presence of a net 63-bp insertion in the mutant sample. (D) Summary of Sanger sequencing results. Exon sequences are in black, intron sequences are in gray, predicted Cas9 cut sites are in green, insertions are in blue, and red lines indicate deletions. The in-frame stop codon (TGA) generated within the largest insertion sequence is underlined. Detailed Sanger sequencing data are in Fig. S1. (E) RNA sequencing probe alignments around the Cas9-targeted region in 4 mpf psap+63/+63 and WT sibling brains, demonstrating preservation of the mutations detected at the genomic DNA level. (F) psap mRNA is not degraded based on RNA sequencing of 4 mpf psap+63/+63 (n=4) and WT (n=4) sibling brains. Data show the mean±s.e.m.
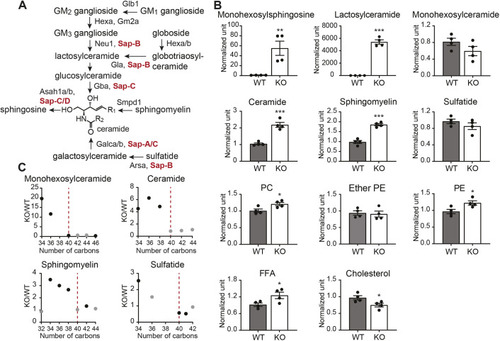
Psap KO zebrafish exhibit altered lipid metabolism. (A) The sphingolipid catabolic pathway. The illustration is based on Özkara (2004). (B) Relative levels of major lipid families in 4 mpf WT (n=4) and psap+63/+63 (n=4) brains. PC, phosphatidylcholine; PE, phosphatidylethanolamine; FFA, free fatty acid. (C) KO/WT fold changes versus the number of carbons in the ceramide core of the lipid species for selected sphingolipid families, demonstrating a rapid drop in the amplitude of lipid accumulation at around 40 carbon atoms, corresponding to a C22 acyl chain for the majority of sphingolipids given the prevalence of the d18 backbone in adult zebrafish brains (Zhang et al., 2019). Data points in black are statistically significant. Additional lipidomics data are in Fig. S3 (4 mpf WT and psap−14/−14 brains) and Tables S1 and S2. Data show the mean±s.e.m. Two-tailed unpaired Student's t-test was used. *P<0.05, **P<0.01, ***P<0.001.
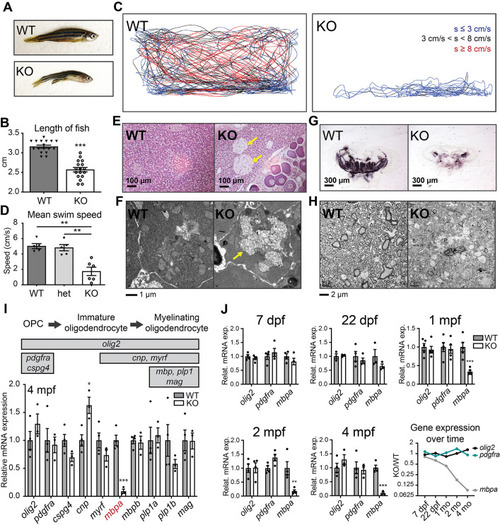
Psap KO zebrafish exhibit impaired locomotion, storage material accumulation and myelin loss without significant loss of oligodendrocyte markers. (A) Representative images of a 4 mpf psap+63/+63 zebrafish and WT sibling. Length distributions of 4 mpf WT and psap KO zebrafish are shown in B. (B) Length measurements of 4 mpf psap+63/+63 zebrafish and WT siblings. n=17 WT, 17 psap+63/+63 fish. A decreased length was observed in nearly all psap+63/+63 and psap−14/−14 zebrafish for each generation examined. (C) Swim behavior tracking for 4 mpf psap−14/−14 and WT zebrafish. Disrupted locomotion was present in all psap+63/+63 and psap−14/−14 zebrafish for each generation examined. Representative data from five WT and six psap−14/−14 zebrafish. s, swim speed. Zebrafish were filmed from the side of a 2.75-l fish tank. The filming area encompasses the entire side view of the tank and is ∼28 cm in length and 13 cm in height. (D) Mean swim speed of 4 mpf WT, psap−14/+ and psap−14/−14 zebrafish. (E) H&E staining of 4 mpf psap+63/+63 and WT zebrafish liver sections. Representative data from three WT, one psap−14/−14 and three psap+63/+63 zebrafish. Arrows point to regions containing large, foamy cell clusters. (F) Transmission electron microscopy (TEM) of 4 mpf psap+63/+63 and WT zebrafish livers. The arrow indicates regions of storage material accumulation. Representative data from three WT and three psap+63/+63 zebrafish. (G) Black Gold II staining of frozen brain sections from 4 mpf psap+63/+63 zebrafish and WT siblings. Representative data from five WT and five psap+63/+63 zebrafish. Additional serial sections are in Fig. S5, and several brain sections from G are also reproduced among the sequential sections in Fig. S5. (H) TEM of optic nerve sections from 4 mpf psap+63/+63 zebrafish and WT siblings. Representative data from five WT and six psap+63/+63 zebrafish. (I) Schematic of the expression of stage-specific marker genes (top). qRT-PCR of major oligodendrocyte differentiation markers in 4 mpf psap+63/+63 and WT sibling zebrafish brains (bottom). Representative data from two independent datasets; n=4 WT and 4 psap+63/+63 for each dataset. (J) qRT-PCR of olig2, pdgfra and mbpa over the course of psap+63/+63 and WT sibling zebrafish brain development. Representative data from at least two independent datasets for each time point; n=3-5 WT and 3-5 psap+63/+63 for each dataset. Data show the mean±s.e.m. For B,D,I,J, two-tailed unpaired Student's t-test was used. *P<0.05; **P<0.01, ***P<0.001.
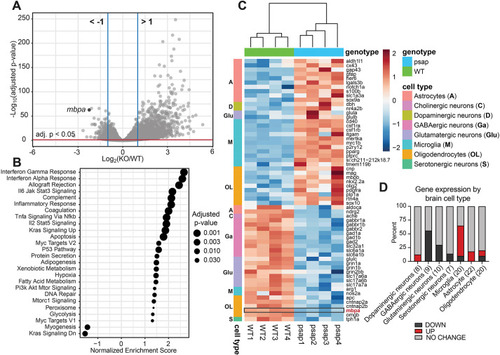
Brain transcriptomics identifies upregulated inflammation and mTORC1 signaling in psap+63/+63 zebrafish. (A) Volcano plot of all annotated genes from transcriptomics analysis of 4 mpf WT (n=4) and psap+63/+63 (n=4) zebrafish brains. mbpa is indicated on graph. Differential expression analysis data are in Table S3. (B) Gene set enrichment analysis (GSEA) of transcriptomics data (all genes from Table S3) using the Hallmark gene sets (MSigDB Collections). Additional GSEA analyses are in Table S4. (C) Hierarchical clustering analysis of WT and psap+63/+63 RNA sequencing data based on a manually curated list of 98 brain cell-type-specific marker genes (Table S5). The graph displays the 61 significantly deregulated genes (adjusted P-value <0.05) from the curated list. The boxed region corresponds to mbpa (third gene from bottom). (D) Percentage of up- and down-regulated brain cell type-specific marker genes (Table S5). Numbers in parentheses denote the number of genes in each cell type. ‘UP’ and ‘DOWN’ denote statistically significant (adjusted P-value <0.05) genes for which the relative (KO/WT) expression >1.5 and <0.67, respectively; all additional genes are designated ‘NO CHANGE’.
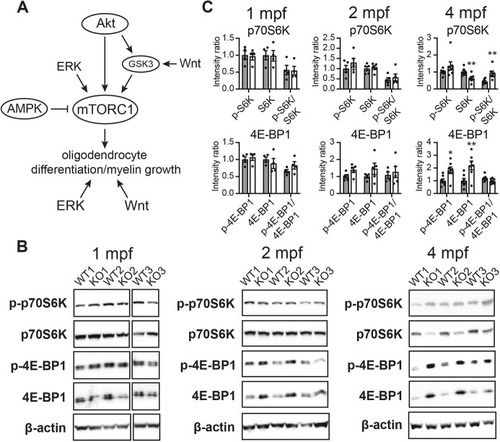
Disrupted mTORC1 signaling does not precede mbpa loss in psap+63/+63 zebrafish. (A) Illustration of the major promyelinating signaling pathways examined in the current study. (B) Western blots of phosphorylated and unphosphorylated p70S6K and 4E-BP1 in psap+63/+63 and WT sibling brains, demonstrating disrupted mTORC1 signaling at 4 mpf but no additional changes. Representative data from n=5-14 WT and n=4-14 psap+63/+63 zebrafish; the signaling status was monitored over three independently propagated generations of fish to yield comparable results. Data for additional pathways illustrated in A are in Fig. S6. (C) Densitometry calculations of p-p70S6K, p70S6K, p-4E-BP1, 4E-BP1, and phosphorylated/non-phosphorylated protein ratios for 1 mpf, 2 mpf and 4 mpf psap+63/+63 zebrafish and WT siblings. Data points for each dataset were normalized to the average of the WT samples in that set. Data show the mean±s.e.m. Two-tailed unpaired Student's t-test was used. *P<0.05, **P<0.01.
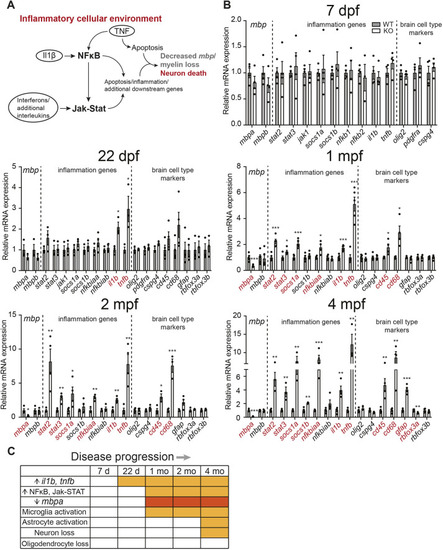
Neuroinflammatory response precedes mbpa loss in psap+63/+63 zebrafish. (A) Schematic of inflammation-driven disease progression in the psap KO model. (B) Relative expressions of representative markers for myelination, inflammation and major brain cell populations at 7 dpf, 22 dpf, 1 mpf (33 dpf), 2 mpf and 4 mpf. Representative data from two independent qRT-PCR datasets; n=3-5 WT and n=3-5 psap+63/+63 for each dataset. Data points for each dataset were normalized to the average of the WT samples in that set. Data show the mean±s.e.m. Two-tailed unpaired Student's t-test was used. *P<0.05; **P<0.01, ***P<0.001. (C) Table illustrating the onset of major cellular events in psap+63/+63 zebrafish relative to WT siblings, based on first appearance of statistically significant changes in the corresponding marker genes. Red boxes denote statistically significant time points for mbpa; orange boxes denote statistically significant time points for all additional pathway markers.
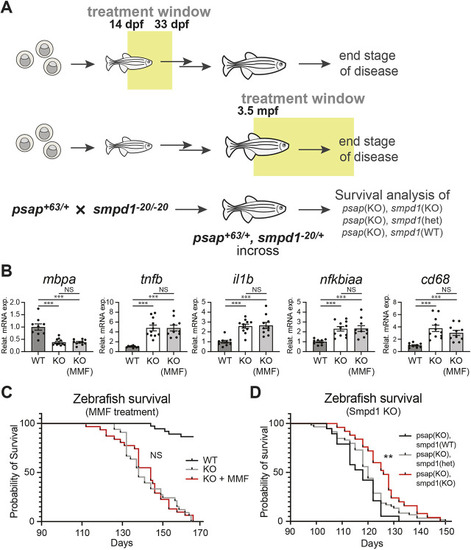
Two strategies toward therapy in the psap KO model. (A) Three treatment schemes in the psap KO model. (B) qRT-PCR of mbpa, tnfb, il1b, nfkbiaa and cd68 in 33 dpf WT (n=9), untreated psap+63/+63 (n=11), and MMF-treated psap+63/+63 (n=10) zebrafish brains. Data show the mean±s.e.m. Two-tailed unpaired Student's t-test was used. NS, not significant; ***P<0.001. (C) Survival analysis of WT (n=37), untreated psap+63/+63 (n=33) and MMF-treated psap+63/+63 (n=31) zebrafish starting from 3 mpf. Log-rank (Mantel–Cox) test was used. Results were not significantly different for KO versus KO+MMF; P<0.001 for WT versus KO and WT versus KO+MMF. (D) Survival analysis of psap+63/+63, smpd1+/+ (KO/WT, black line) (n=19); psap+63/+63, smpd1−20/+ (KO/het, gray line) (n=59); and psap+63/+63, smpd1−20/−20 (KO/KO, red line) (n=25) zebrafish starting from 3 mpf. Log-rank (Mantel–Cox) test was used. Results were not significantly different for KO/WT versus KO/het and KO/KO versus KO/het. **P<0.01 for KO/WT vs KO/KO.
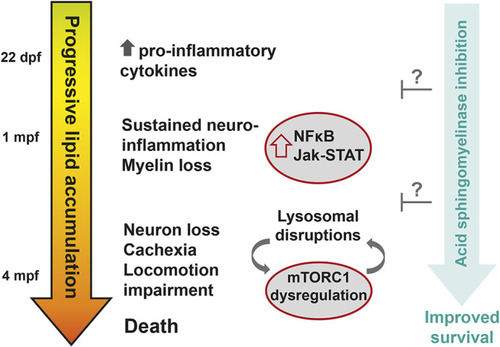
Schematic of the proposed sequence of events driving disease progression in the combined saposin deficiency zebrafish model. Increased tnfb and il1b expression is detected at ∼22 dpf in the psap−/− brain, followed by increased expression of additional neuroinflammatory markers (stat2, stat3, socs1a, nfkbiaa, cd45 and cd68) and loss of myelin (reduced mbpa) at ∼1 mpf; these pathologies worsen over time, preceding loss of neuronal markers (gfap, rbfox3a) and dysregulated mTORC1 signaling at ∼4 mpf, fairly rapid onset of cachexia and locomotion impairment within 2 weeks around the 4-mpf time point, and death of all psap−/− fish by 5 mpf. Knockout of acid sphingomyelinase (smpd1) in psap−/− zebrafish leads to a modest increase in lifespan via yet to be investigated mechanisms.
Acknowledgments
This image is the copyrighted work of the attributed author or publisher, and
ZFIN has permission only to display this image to its users.
Additional permissions should be obtained from the applicable author or publisher of the image.
Full text @ Dis. Model. Mech.
Your Input Welcome
Thank you for submitting comments. Your input has been emailed to ZFIN curators who may contact you if
additional information is required.
Oops. Something went wrong. Please try again later.