Depletion of <italic><styled-content toggle='no' style='fixed-case'>CCP</styled-content>5</italic> rescues the angiogenesis defects caused by <italic><styled-content toggle='no' style='fixed-case'>CEP</styled-content>41</italic> deficiency
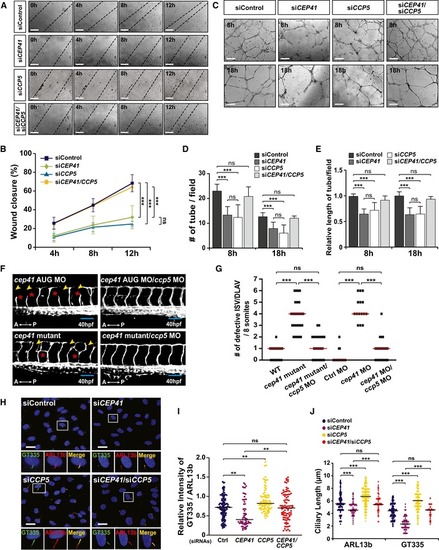
HUVECs transfected with CCP5 and/or CEP41 siRNAs were scratched and incubated to evaluate wound closure. The extent of wound closure in co‐transfected cells with CCP5 and CEP41 siRNAs was compared with that in control or CEP41 siRNA‐transfected cells at the indicated time points (A). Scale bars, 600 μm. Quantification of the extent of wound closure in (A) is presented graphically by measuring the distance between the dotted lines at each time point in (B). Data are shown as mean ± SD of three independent experiments (n ≥3 scratches per experimental condition). Statistical significance was determined using the two‐way ANOVA followed by Tukey's post hoc test (***P <0.001, ns: non‐significant).
The indicated siRNA‐transfected HUVECs were subjected to in vitro angiogenesis assays. Tubulogenesis of HUVECs depleted for CEP41 and CCP5 was compared to that of control, CEP41 single‐knockdown, or CCP5 single‐knockdown cells (C). Scale bars, 600 μm. Quantification of tube node number in (D) and tube length in (E) from data examined within equivalent fields of view at the indicated time points using the ImageJ angiogenesis analyzer. Data are shown as mean ± SD of five independent experiments with ≥ 5 tubulogenesis regions per condition. Statistical significance was determined using the one‐way ANOVA followed by Tukey's post hoc test (***P <0.001, ns: non‐significant).
The blood vessels in the trunks of cep41‐mutant/morphant zebrafish were compared to those of zebrafish co‐injected with ccp5 MOs (2 ng) at 40 hpf in (F). Asterisks and arrowheads indicate impaired ISVs and DLAVs, respectively. A, anterior; P, posterior. Scale bars, 100 μm. Quantification of the number of defective ISVs and DLAVs from data observed in equivalent fields of view (within eight somites). Data are median of three independent experiments with ≥ 20 embryos per condition. Statistical significance was determined using the Kruskal–Wallis test followed by Dunn's post hoc test (***P <0.001).
HUVECs co‐transfected with CEP41 and CCP5 siRNAs were immunostained with ARL13b‐ and GT335‐specific antibodies. The staining results were compared to those of control, single CEP41, or CCP5 siRNA‐transfected cells. Representative images indicated with rectangles appear in magnified images in the lower panels. Scale bars, 20 μm. Quantification of relative intensity of GT335/ARL13b signals in the cilia (I) and ciliary length (J) in images (H) is the result of three independent experiments with ≥ 200 cells per condition (median). **P <0.01, ***P <0.001, ns: non‐significant (Kruskal–Wallis test with Dunn's post hoc test).
This image is the copyrighted work of the attributed author or publisher, and
ZFIN has permission only to display this image to its users.
Additional permissions should be obtained from the applicable author or publisher of the image.
Full text @ EMBO Rep.
Your Input Welcome
Thank you for submitting comments. Your input has been emailed to ZFIN curators who may contact you if
additional information is required.
Oops. Something went wrong. Please try again later.