FIGURE

Figure 1

ID
ZDB-FIG-200212-33
Publication
Ki et al., 2019 - CEP41-mediated ciliary tubulin glutamylation drives angiogenesis through AURKA-dependent deciliation
Other Figures
All Figure Page
Back to All Figure Page
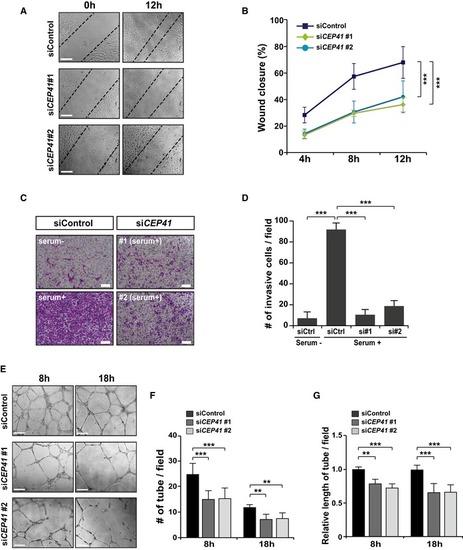
Figure 1

<italic><styled-content toggle='no' style='fixed-case'>CEP</styled-content>41</italic> depletion restricts endothelial cell behavior

HUVECs transfected with control or CEP41 siRNAs were scratched (0 h) to induce wounding and then incubated for 12 h to allow wound closure. The wound margins were observed every 4 h in the CEP41#1 and #2 siRNA‐transfected cells and compared to those of control cells. Representative images of cells subjected to the wound closure assay in (A). Scale bars, 600 μm. Quantification of the extent of wound closure in (B) presented graphically by measuring the distance between the dotted lines at each time point. Data are shown as mean ± SD of three independent experiments ( 3 scratches per experimental condition). Statistical significance was assessed using the two‐way ANOVA followed by Tukey's post hoc test (***< 0.001).

The siRNA‐transfected HUVECs were plated inside a transwell chamber and incubated with serum for 18 h. The cells that invaded were observed after staining with crystal violet (CV) solution. Scale bars, 600 μm. The numbers of cells that invaded in each field of view were counted with the ImageJ software in (D). The data indicate the results of three independent experiments with ≥ 3 invasions per condition (mean ± SD). ***< 0.001 (one‐way ANOVA with Tukey's post hoc test).

Tubulogenesis of control and CEP41‐knockdown cells for 18 h was compared via an in vitro angiogenesis assay. Scale bars, 600 μm. Quantification of tube node numbers in (F) and tube length in (G) from each field of view using the ImageJ angiogenesis analyzer at the indicated time points. The graph compares the relative length of control cells and CEP41‐knockdown cells. Data are shown as mean ± SD of five independent experiments with ≥ 5 tubulogenesis regions per condition. Statistical significance was assessed with the two‐way ANOVA followed by Tukey's post hoc test (**< 0.01, ***< 0.001).

Expression Data

Expression Detail
Antibody Labeling
Phenotype Data

Phenotype Detail
Acknowledgments
This image is the copyrighted work of the attributed author or publisher, and ZFIN has permission only to display this image to its users. Additional permissions should be obtained from the applicable author or publisher of the image. Full text @ EMBO Rep.