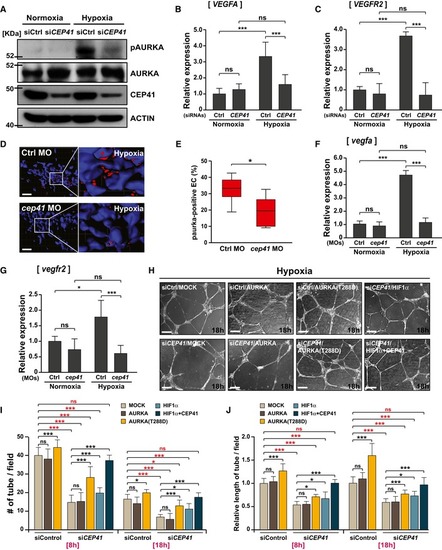
The control or CEP41 siRNA‐transfected HUVECs were cultivated under hypoxia (1% O2), and their whole‐cell lysates were used for immunoblot assays of CEP41, phospho‐AURKA, and AURKA. The resulting data were also compared to those of normoxic cells. Protein levels were normalized against β‐actin in the same blots.
VEGFA (B) and VEGFR2 (C) mRNA levels were measured by qRT–PCR using cDNA from normoxic and hypoxic controls or CEP41‐depleted cells. The expression of GAPDH was quantified for the normalization of those qRT–PCR results. Data are shown as mean ± SD of three independent experiments. Statistical significance was determined with the one‐way ANOVA followed by Tukey's post hoc test (***P <0.001, ns: non‐significant).
Tg(kdrl:eGFP) zebrafish were injected with control‐ or cep41‐MOs and then incubated under hypoxia at 28 hpf (a stage of high shear stress) for 2 h. They were subjected to immunostaining with phospho‐AURKA‐specific antibodies (red) and DAPI at 30 hpf. The insets indicate the representative areas from each immunostaining, and red dots indicate activated AURKA within ECs. Scale bars, 40 μm. Quantification of phospho‐AURKA‐positive ECs (E) in equivalent fields of view for each MO‐injected zebrafish in (D) is the result of three independent experiments with ≥ 20 embryos per condition. The top and bottom whiskers represent the maximum and minimum values, respectively. *P <0.05 (unpaired Student's t‐test).
Zebrafish vegfa (F) and vegfr2 (G) mRNA levels were quantified by qRT–PCR in eGFP‐positive ECs of control‐ or cep41‐MO‐injected Tg(kdrl:eGFP) zebrafish subjected to either normoxia or hypoxia at 30 hpf. The expression of zebrafish β‐actin was quantified for the normalization of these qRT–PCR results. Data are shown as mean ± SD of three independent experiments. Statistical significance was determined using the one‐way ANOVA followed by Tukey's post hoc test (*P <0.05, ***P <0.001, ns: non‐significant).
Control and CEP41‐deficient HUVECs, transfected with expression vectors encoding nothing (MOCK), AURKA, AURKA‐T288D, HIF1α, or HIF1α with CEP41, were cultivated under hypoxia and subjected to an in vitro angiogenesis assay for 18 h. Scale bars, 400 μm. Quantification of tube node number in (I) and tube length in (J) from data examined within equivalent fields of view at each time point using the ImageJ angiogenesis analyzer. Data are shown as mean ± SD of five independent experiments with ≥ 5 tubulogenesis regions per condition. Statistical significance was determined using the two‐way ANOVA followed by Tukey's post hoc test (*P <0.05, ***P <0.001, ns: non‐significant).
This image is the copyrighted work of the attributed author or publisher, and
ZFIN has permission only to display this image to its users.
Additional permissions should be obtained from the applicable author or publisher of the image.
Full text @ EMBO Rep.
Your Input Welcome
Thank you for submitting comments. Your input has been emailed to ZFIN curators who may contact you if
additional information is required.
Oops. Something went wrong. Please try again later.