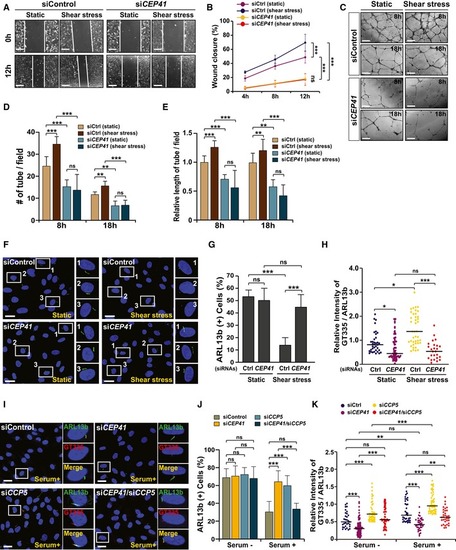
Depletion of <italic><styled-content toggle='no' style='fixed-case'>CEP</styled-content>41</italic> prevents shear stress‐induced endothelial cell dynamics and cilia disassembly
Control or CEP41 siRNA‐transfected HUVECs cultivated under either static or shear stress states and examined in a wound healing assay in (A). Scale bars, 600 μm. Quantification of the extent of wound closure in (A) displayed graphically by measuring the distance between the lines at the indicated time points in (B). Data are presented as mean ± SD of three independent experiments (n ≥3 scratches per experimental condition). Statistical significance was determined using the two‐way ANOVA followed by Tukey's post hoc test (***P <0.01, ns: non‐significant).
An in vitro angiogenesis assay was performed in static or shear stress‐exposed HUVECs transfected with the indicated siRNAs for 18 h in (C). Scale bars, 600 μm. Quantification of tube node number in (D) and tube length in (E) from data examined within equivalent fields of view at each time point using the ImageJ angiogenesis analyzer. Data are shown as mean ± SD of five independent experiments with ≥ 5 tubulogenesis regions per condition. Statistical significance was determined using the two‐way ANOVA followed by Tukey's post hoc test (**P <0.01, ***P <0.001, ns: non‐significant).
Control or CEP41‐deficient HUVECs cultivated under laminar shear stress and immunostained with ARL13b‐specific antibodies to measure deciliation. Representative images are indicated by rectangles with numbers and shown in magnified images in the right panels. The resulting data were compared to those of cells under static conditions in (F). Scale bars, 20 μm. Quantification of ARL13b‐positive ciliary cells (G) and of relative intensity of GT335/ARL13b signals in the cilia (H) in images (F) is the results of three independent experiments with ≥ 200 cells per condition (mean ± SD (G), median (H)). *P <0.05, ***P <0.001, ns: non‐significant (two‐way ANOVA with Tukey's post hoc test (G) and Kruskal–Wallis test with Dunn's post hoc test (H)).
Control, CEP41‐, or CCP5‐depleted hTERT‐RPE1 cells cultured under serum starvation for 48 h and fixed at 18 h after serum retrieval for immunostaining with both ARL13b‐ and GT335‐specific antibodies in (I). Images of the results 18 h after serum addition. Representative cells are indicated by rectangles. Scale bars, 20 μm. Quantification of ARL13b‐positive ciliated cells (J) and relative intensity of GT335/ARL13b signals in the cilia (K) under either serum starvation or serum retrieval (18 h) conditions are the results of three independent experiments with ≥ 200 cells per condition (mean ± SD (J), median (K)). **P <0.01, ***P <0.001, ns: non‐significant (one‐way ANOVA with Tukey's post hoc test (J) and Kruskal–Wallis test with Dunn's post hoc test (K)).
Expression Data
Expression Detail
Antibody Labeling
Phenotype Data
Phenotype Detail
Acknowledgments
This image is the copyrighted work of the attributed author or publisher, and
ZFIN has permission only to display this image to its users.
Additional permissions should be obtained from the applicable author or publisher of the image.
Full text @ EMBO Rep.
Your Input Welcome
Thank you for submitting comments. Your input has been emailed to ZFIN curators who may contact you if
additional information is required.
Oops. Something went wrong. Please try again later.