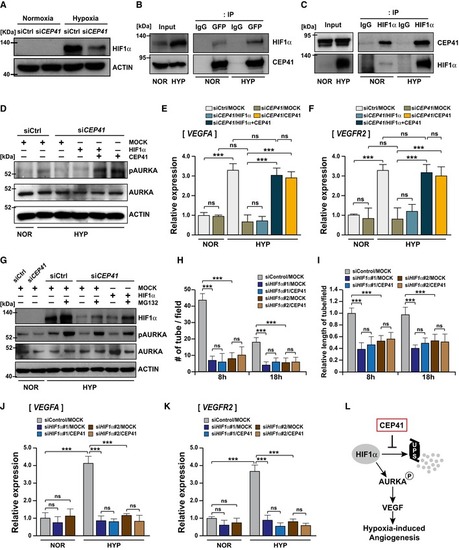
<styled-content toggle='no' style='fixed-case'>CEP</styled-content>41 functions upstream of <styled-content toggle='no' style='fixed-case'>HIF</styled-content>1α through physical interaction with it to drive hypoxia‐induced angiogenesis
HUVECs transfected with control or CEP41 siRNAs were cultivated under hypoxia, and their whole‐cell lysates were used for immunoblot assays of HIF1α. The HIF1α expression of hypoxic cells was compared to that of normoxic cells, and the protein levels were normalized against β‐actin in the same blot.
Co‐immunoprecipitation assays using HIF1α‐ and CEP41‐specific antibodies were performed in HEK 293T cells expressing GFP‐CEP41 under normoxia or hypoxia. An IP using IgG‐specific antibodies was performed as a negative control. NOR, normoxia; HYP, hypoxia.
The CEP41‐depleted HUVECs were transfected with expression vectors encoding nothing (MOCK), CEP41, or HIF1α and cultivated under hypoxia. Whole‐cell lysates were used for immunoblot assays for phospho‐AURKA and AURKA, and the resulting data were compared to those of normoxic and hypoxic control cells. Protein levels were normalized against β‐actin in the same blots. NOR, normoxia; HYP, hypoxia.
The CEP41‐deficient HUVECs were transfected with expression vectors encoding nothing (MOCK), CEP41, HIF1α, or HIF1α with CEP41 and exposed to hypoxia. VEGFA (E) and VEGFR2 (F) mRNA levels were analyzed by qRT–PCR using cDNA from transfected cells. Data are shown as mean ± SD of three independent experiments. Statistical significance was determined using the one‐way ANOVA followed by Tukey's post hoc test (***P <0.001, ns: non‐significant). NOR, normoxia; HYP, hypoxia.
Control or CEP41‐depleted HUVECs were transfected with expression vectors encoding nothing (MOCK) or HIF1α and treated with MG132 or not, and then, the cells were cultivated under hypoxia. Whole‐cell lysates were used for immunoblot assays for HIF1α, phospho‐AURKA, and AURKA, and the protein levels were normalized against β‐actin in the same blots. NOR, normoxia; HYP, hypoxia.
Quantification of tube node number in (H) and tube length in (I) from in vitro angiogenesis assays with HIF1α #1 or #2 siRNAs‐transfected HUVECs overexpressing nothing (MOCK) or CEP41 under hypoxia. Data are shown as mean ± SD of five independent experiments with ≥ 5 tubulogenesis regions per condition. Statistical significance was determined with the two‐way ANOVA followed by Tukey's post hoc test (***P <0.001, ns: non‐significant).
VEGFA (J) and VEGFR2 (K) mRNA levels were analyzed by qRT–PCR using cDNA from hypoxic HIF1α‐depleted HUVECs transfected with control or CEP41 expression vectors. The results were compared to those of control and normoxic HIF1α‐depleted cells. Data are shown as mean ± SD of three independent experiments. Statistical significance was determined using the one‐way ANOVA followed by Tukey's post hoc test (***P <0.001, ns: non‐significant).
A schematic diagram showing the molecular mechanism by which CEP41 drives hypoxia‐induced angiogenesis.
Source data are available online for this figure.
Expression Data
Expression Detail
Antibody Labeling
Phenotype Data
Phenotype Detail
Acknowledgments
This image is the copyrighted work of the attributed author or publisher, and
ZFIN has permission only to display this image to its users.
Additional permissions should be obtained from the applicable author or publisher of the image.
Full text @ EMBO Rep.
Your Input Welcome
Thank you for submitting comments. Your input has been emailed to ZFIN curators who may contact you if
additional information is required.
Oops. Something went wrong. Please try again later.